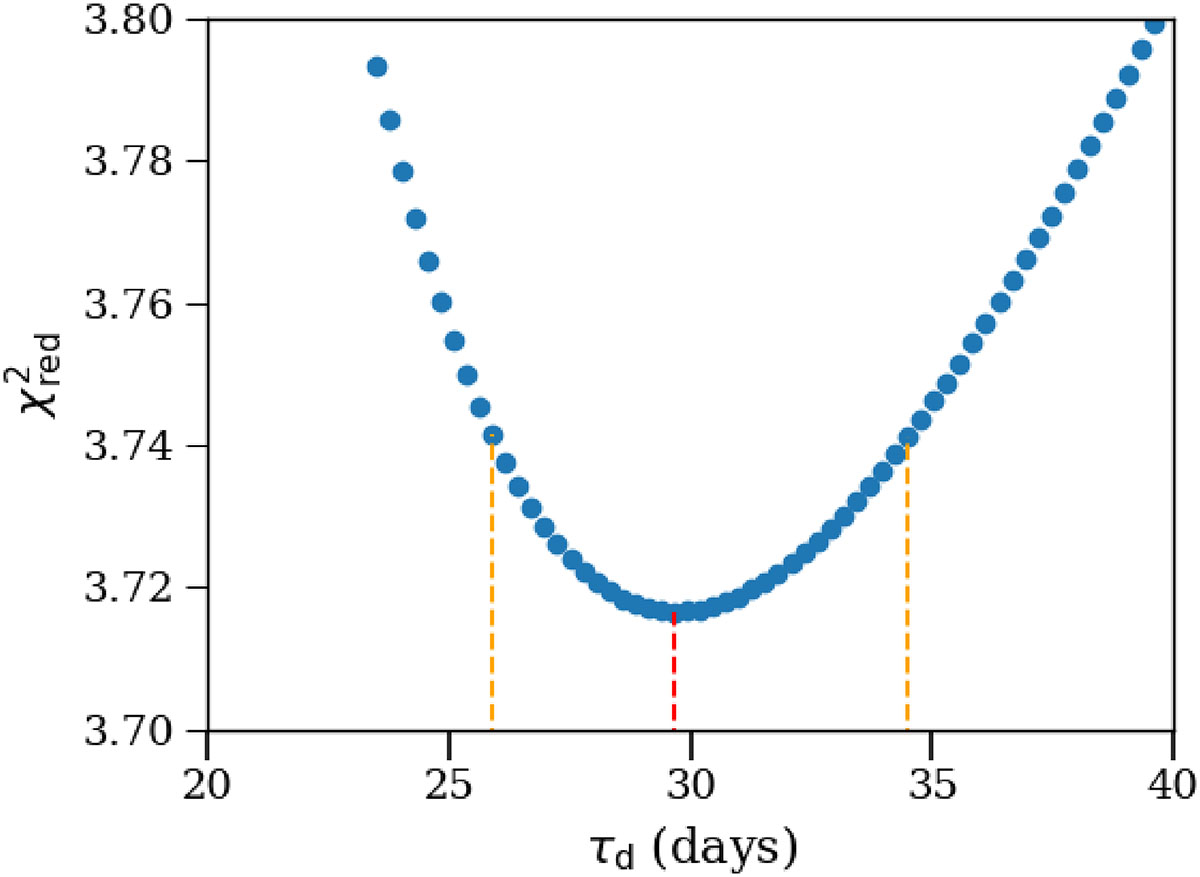
Fig. 1.
Download original image
Example of the exploratory process to determine possible values for an exponential relaxation timescale. The blue dots corresponds to the χred2 values of glitch 64, over a subset of the total range of trial τd values focused around the timescale that returns the minimum χred2 (marked by the red line). The dashed orange lines denote the 1σ uncertainty. These rather high χred2 values are used only to identify a possible timescale. Further analyses are performed for the final measurements (Table 2).
Current usage metrics show cumulative count of Article Views (full-text article views including HTML views, PDF and ePub downloads, according to the available data) and Abstracts Views on Vision4Press platform.
Data correspond to usage on the plateform after 2015. The current usage metrics is available 48-96 hours after online publication and is updated daily on week days.
Initial download of the metrics may take a while.