Open Access
Fig. 11.
Download original image
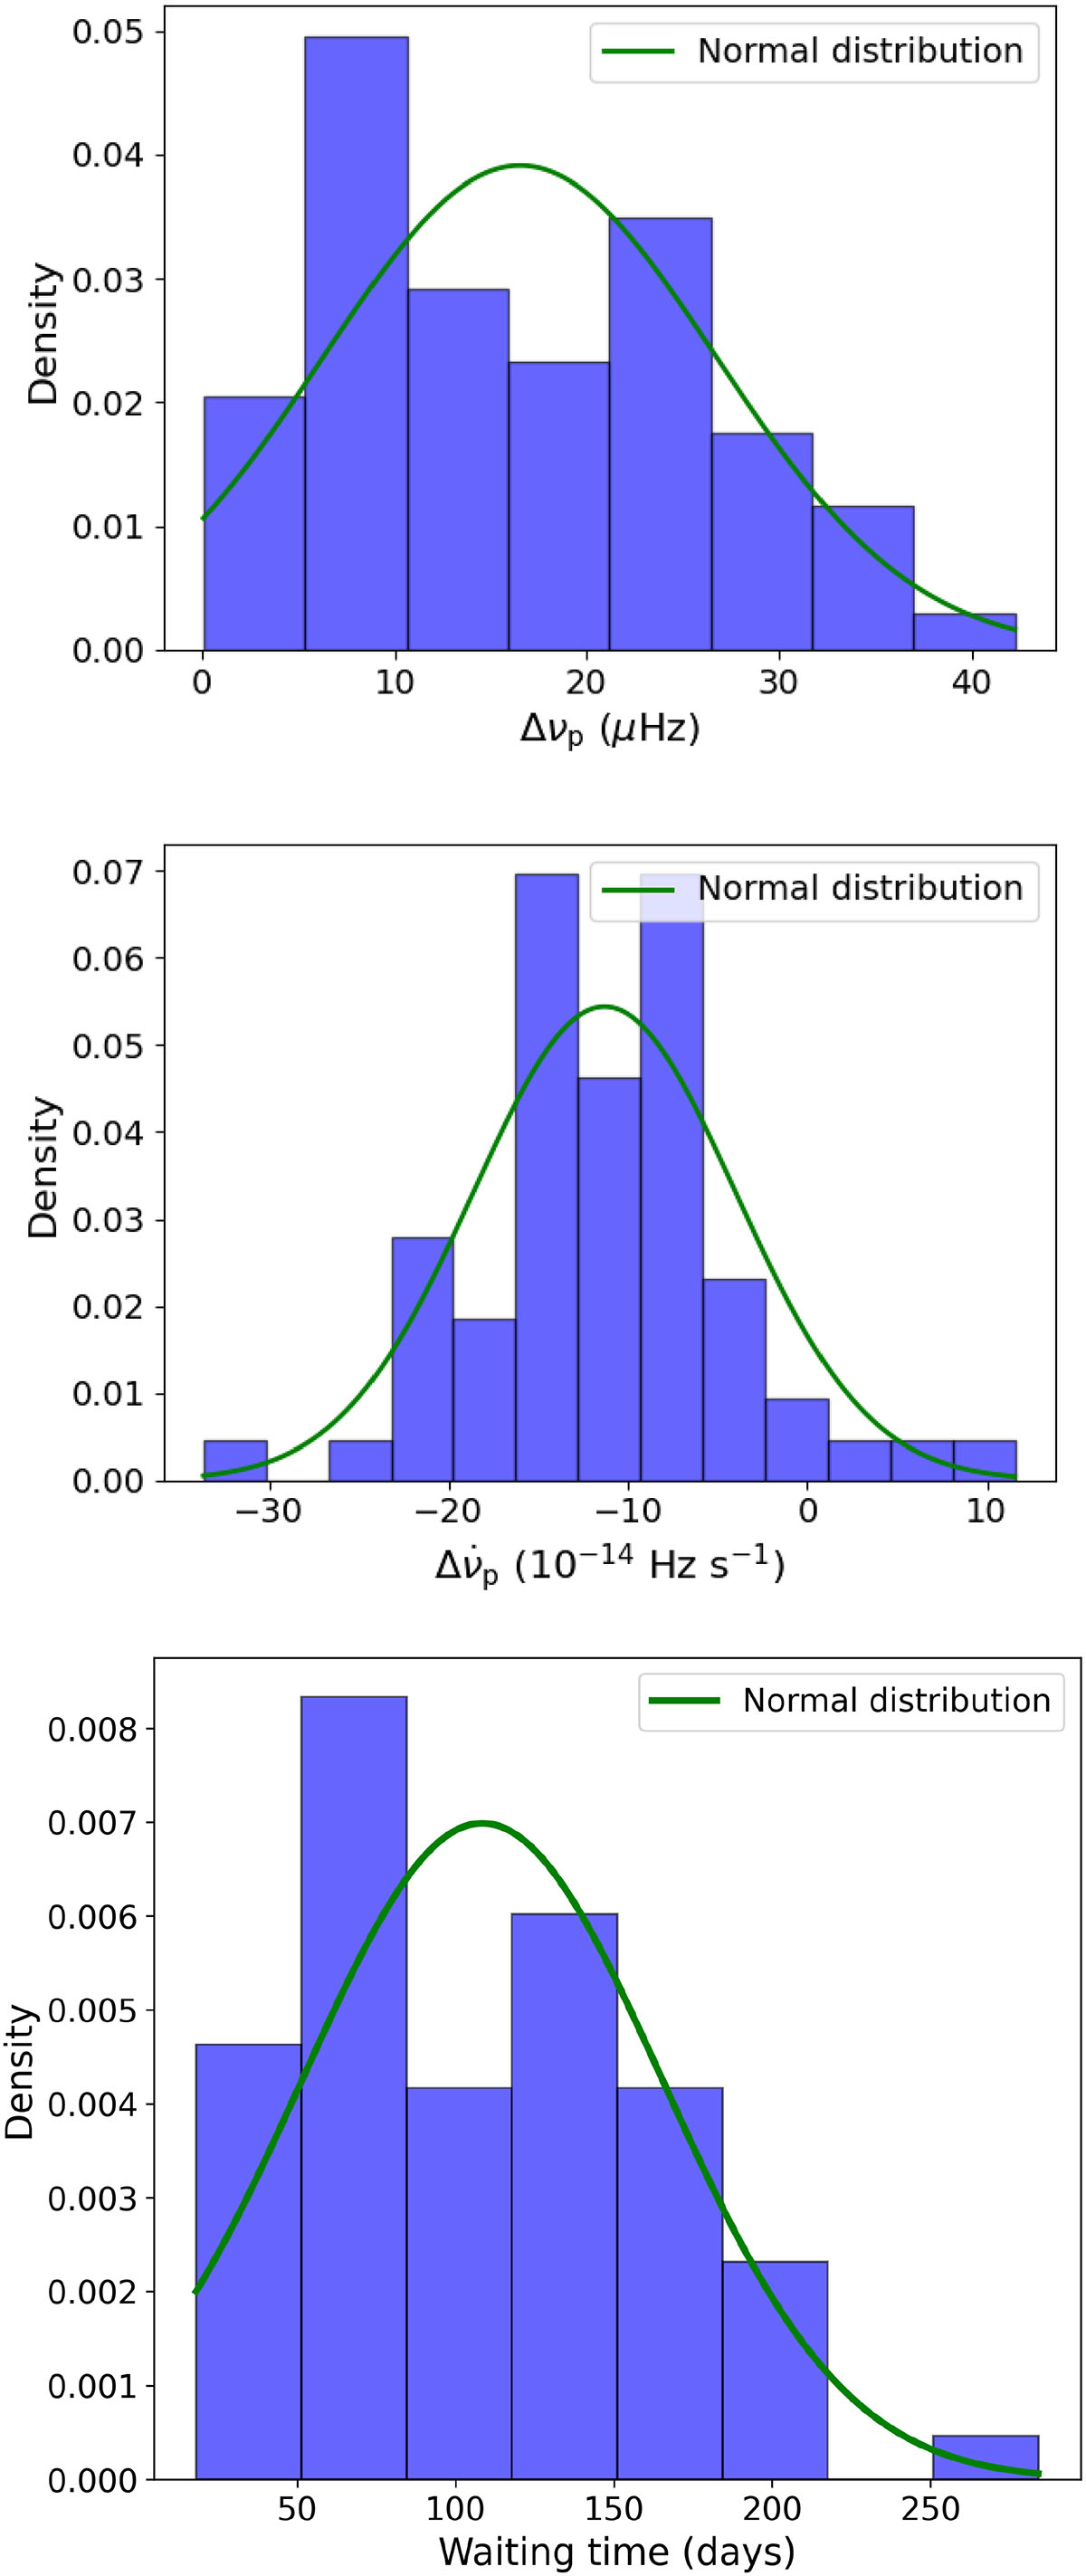
Distribution of Δνp (top panel), ![]() (middle panel), and the waiting times (bottom panel) of the glitches studied in this work. Δνp and
(middle panel), and the waiting times (bottom panel) of the glitches studied in this work. Δνp and ![]() are fitted with a normal distribution, and the waiting times with a normal and a bimodal distribution.
are fitted with a normal distribution, and the waiting times with a normal and a bimodal distribution.
Current usage metrics show cumulative count of Article Views (full-text article views including HTML views, PDF and ePub downloads, according to the available data) and Abstracts Views on Vision4Press platform.
Data correspond to usage on the plateform after 2015. The current usage metrics is available 48-96 hours after online publication and is updated daily on week days.
Initial download of the metrics may take a while.