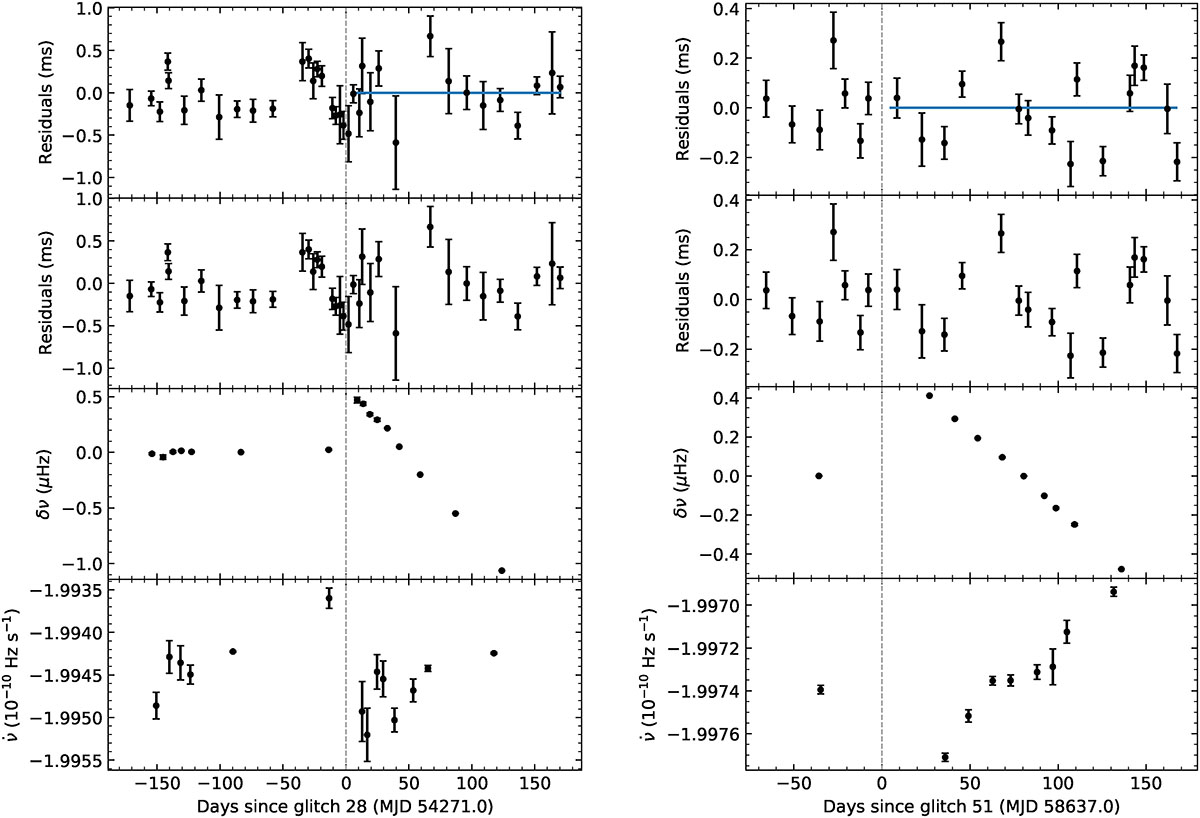
Fig. B.1.
Download original image
Examples of glitches 28 (left) and 51 (right) without a detected exponential recovery. From top to bottom: Phase residuals relative to Model 1, with the residuals (blue curve) of the most likely exponential recovery model (Model 2 relative to Model 1), corresponding here to zero, superimposed; phase residuals relative to Model 2; frequency residuals relative to Eq. 1 fitted to TOAs up to the glitch epoch, with the post-glitch data all lowered by a certain amount (the mean post-glitch frequency residual) for better visualisation; and ![]() evolution with Model 2, when used as the favoured model, shown as the blue curve.
evolution with Model 2, when used as the favoured model, shown as the blue curve.
Current usage metrics show cumulative count of Article Views (full-text article views including HTML views, PDF and ePub downloads, according to the available data) and Abstracts Views on Vision4Press platform.
Data correspond to usage on the plateform after 2015. The current usage metrics is available 48-96 hours after online publication and is updated daily on week days.
Initial download of the metrics may take a while.