Fig. 5.
Download original image
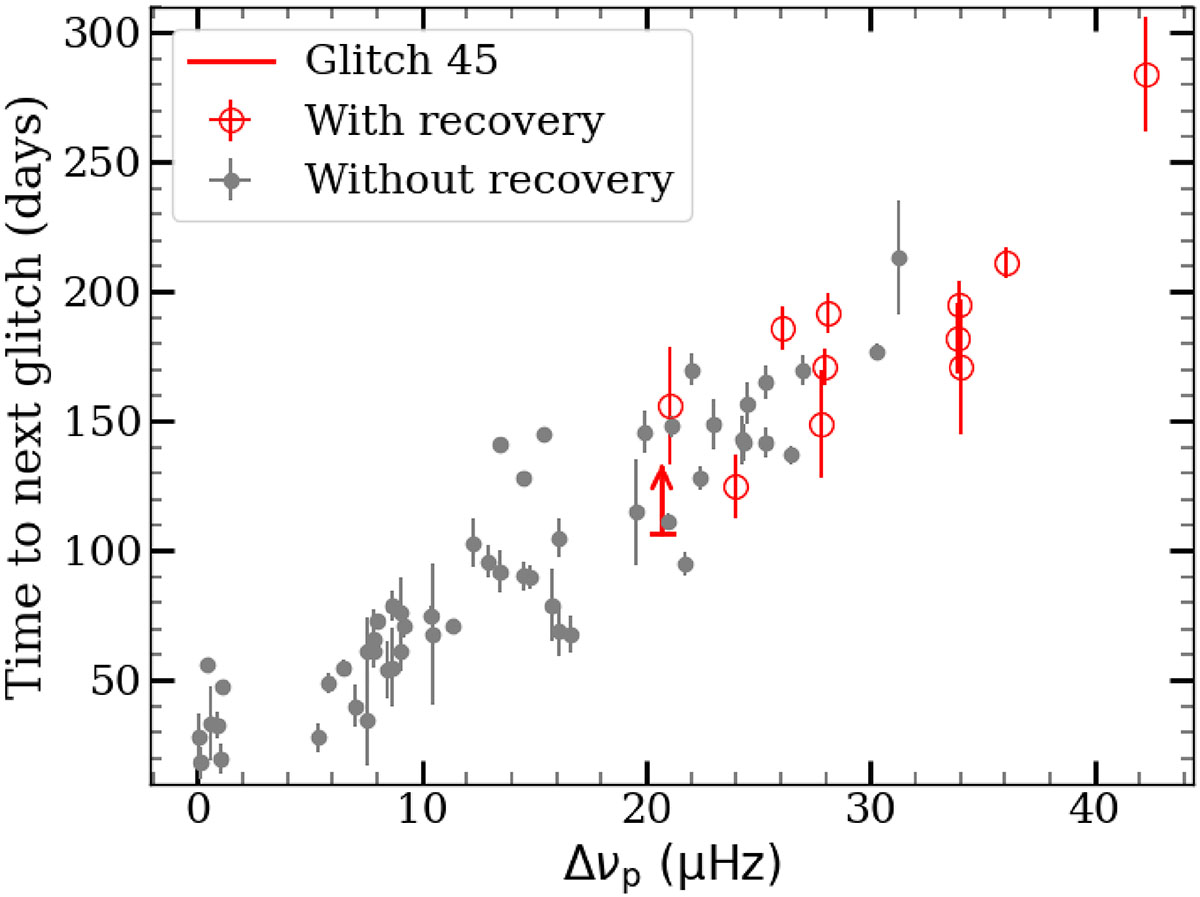
Time to the next glitch as a function of Δνp for 66 glitches of PSR J0537−6910. Red markers indicate glitches for which an exponential recovery was detected. Using Model 2 solutions in these cases improves the size-waiting time correlation. Glitch 45, with a detected recovery, is the last glitch in the RXTE dataset, which ends 107 d after. Thus, the time to the next glitch is unknown, and it is plotted with a vertical arrow indicating the lower limit. The latest glitch reported in this work is glitch 66, which we are able to include in this plot as we know that glitch 67 occurred on MJD 60592.
Current usage metrics show cumulative count of Article Views (full-text article views including HTML views, PDF and ePub downloads, according to the available data) and Abstracts Views on Vision4Press platform.
Data correspond to usage on the plateform after 2015. The current usage metrics is available 48-96 hours after online publication and is updated daily on week days.
Initial download of the metrics may take a while.