Fig. 6.
Download original image
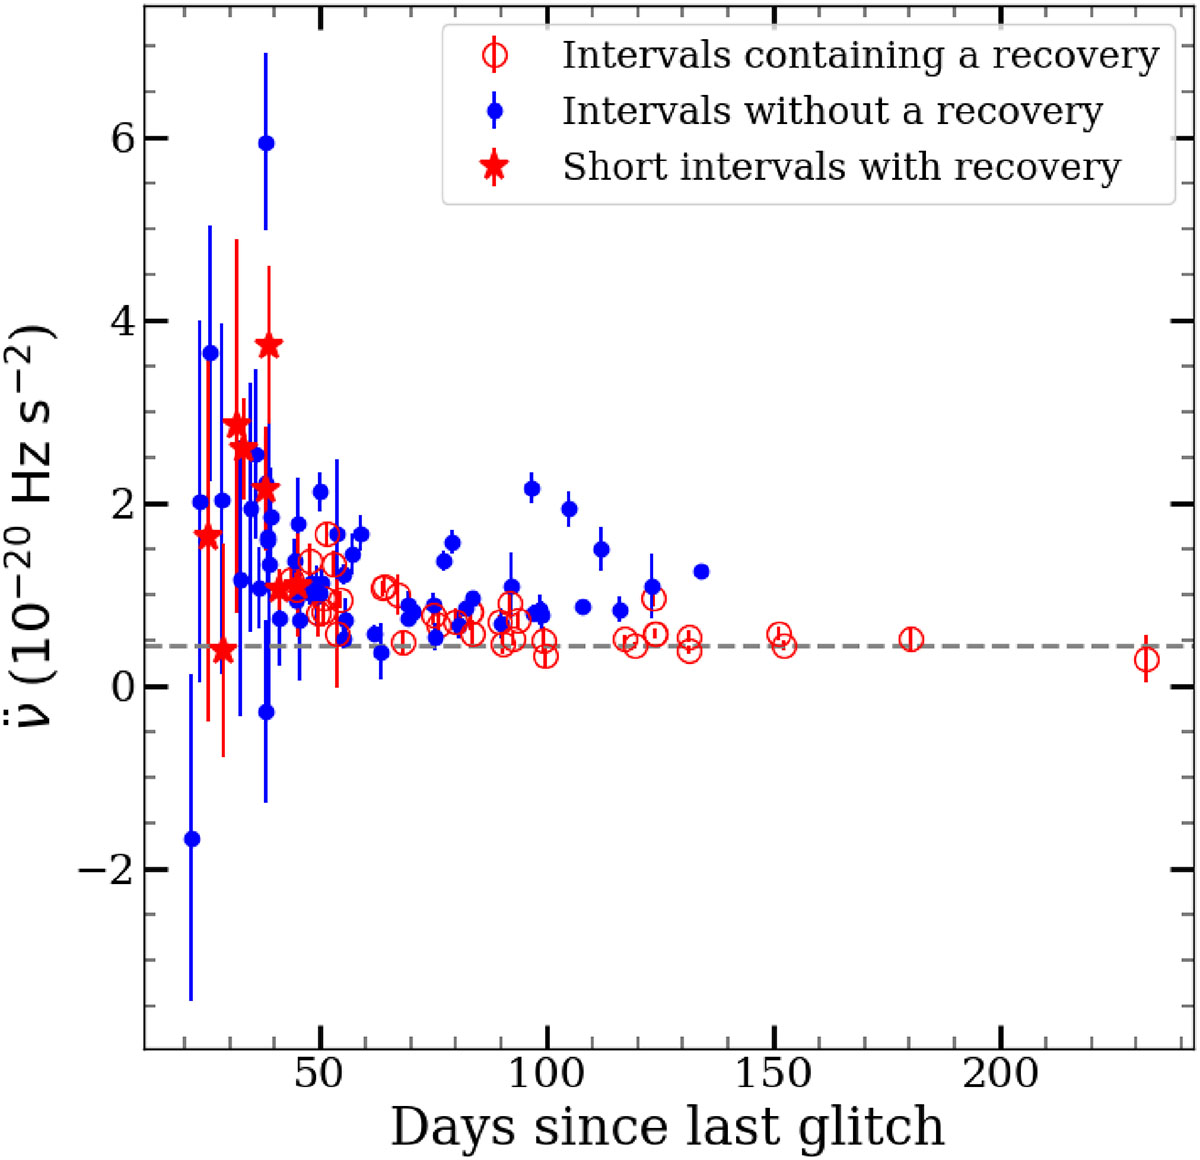
![]() vs. time since the preceding glitch. The horizontal dashed line indicates
vs. time since the preceding glitch. The horizontal dashed line indicates ![]() . The data points were obtained by fitting Eq. (1) over a 90-day sliding window, which moved forward 20 days at each step. The full inter-glitch data span was fitted if the inter-glitch interval was shorter than 90 days. The red stars were obtained by fitting smaller windows of at least 30 d and at least eight TOAs immediately after the glitches with a recovery were detected.
. The data points were obtained by fitting Eq. (1) over a 90-day sliding window, which moved forward 20 days at each step. The full inter-glitch data span was fitted if the inter-glitch interval was shorter than 90 days. The red stars were obtained by fitting smaller windows of at least 30 d and at least eight TOAs immediately after the glitches with a recovery were detected.
Current usage metrics show cumulative count of Article Views (full-text article views including HTML views, PDF and ePub downloads, according to the available data) and Abstracts Views on Vision4Press platform.
Data correspond to usage on the plateform after 2015. The current usage metrics is available 48-96 hours after online publication and is updated daily on week days.
Initial download of the metrics may take a while.