Fig. 8.
Download original image
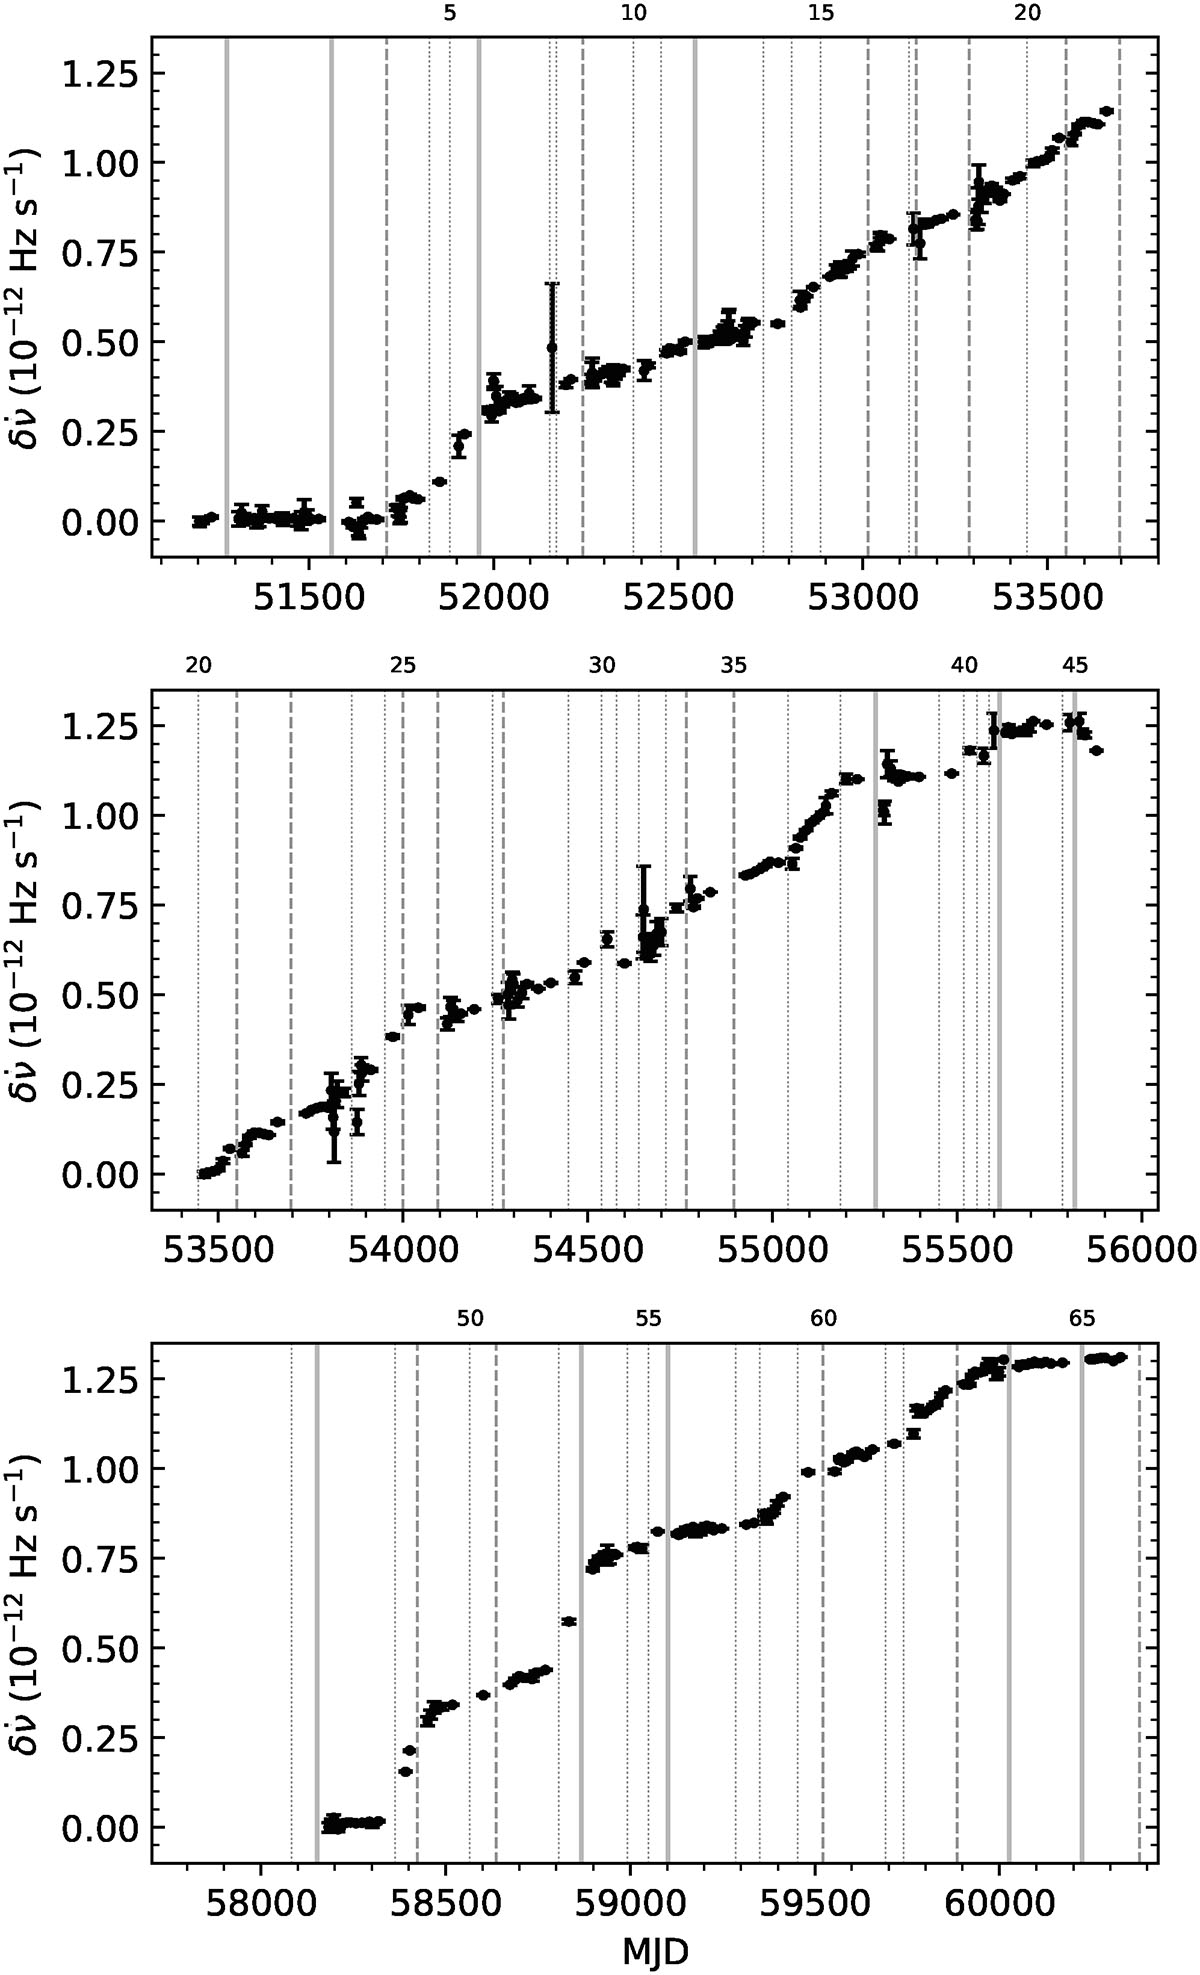
Residuals of ![]() evolution (as calculated for Fig. 7, with the modelled glitch persistent change and exponentially recovering components removed), relative to a linear model with slope
evolution (as calculated for Fig. 7, with the modelled glitch persistent change and exponentially recovering components removed), relative to a linear model with slope ![]() Hz s−2. The full dataset was divided into three sections of similar length, shown in the three panels (RXTE data in the two superior panels and NICER at the bottom). All plots have equal vertical and horizontal scales. The solid grey lines mark the epochs of the glitches with a detected exponential recovery; dashed lines mark the epochs of glitches with Δν > 19 μHz; and thin dotted lines represent the epochs of smaller glitches. Glitch numbers are indicated at top of each panel.
Hz s−2. The full dataset was divided into three sections of similar length, shown in the three panels (RXTE data in the two superior panels and NICER at the bottom). All plots have equal vertical and horizontal scales. The solid grey lines mark the epochs of the glitches with a detected exponential recovery; dashed lines mark the epochs of glitches with Δν > 19 μHz; and thin dotted lines represent the epochs of smaller glitches. Glitch numbers are indicated at top of each panel.
Current usage metrics show cumulative count of Article Views (full-text article views including HTML views, PDF and ePub downloads, according to the available data) and Abstracts Views on Vision4Press platform.
Data correspond to usage on the plateform after 2015. The current usage metrics is available 48-96 hours after online publication and is updated daily on week days.
Initial download of the metrics may take a while.