Fig. 10.
Download original image
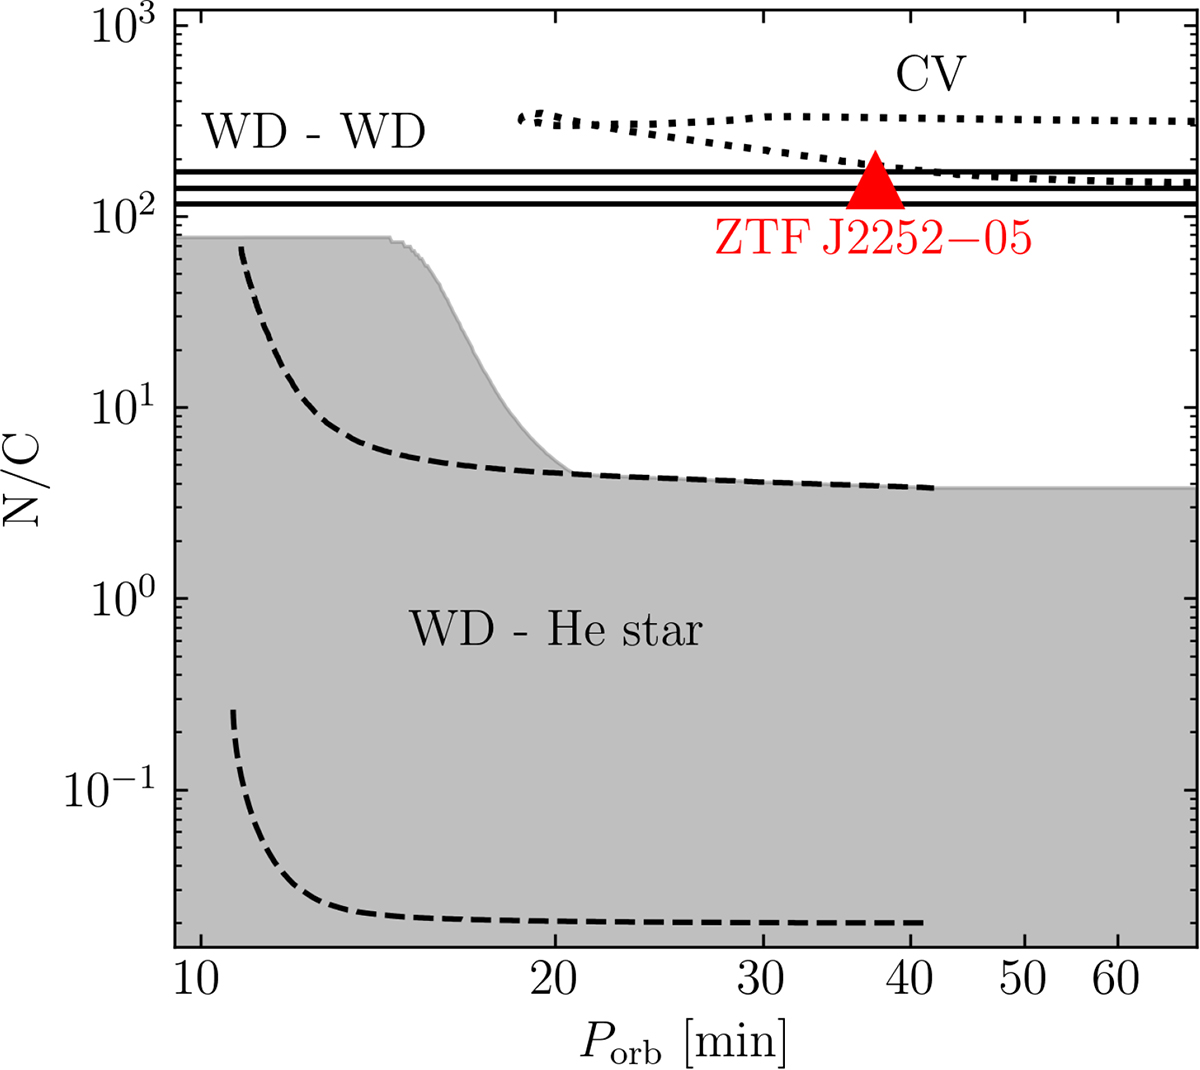
Derived limit N/C > 153 (red triangle) compared with evolutionary models. WD and He-star channel models are taken from Nelemans et al. (2010). WD donor tracks with progenitor masses of 1.0, 1.5, and 2.0 M⊙ (from top to bottom) are shown as solid lines. The possible He-star donor region is indicated by the shaded area, with two examples for initial orbital periods of 20 and 60 min (upper and lower dashed lines). The CV-channel model (dashed line) is calculated using the system parameters listed in Table 3.
Current usage metrics show cumulative count of Article Views (full-text article views including HTML views, PDF and ePub downloads, according to the available data) and Abstracts Views on Vision4Press platform.
Data correspond to usage on the plateform after 2015. The current usage metrics is available 48-96 hours after online publication and is updated daily on week days.
Initial download of the metrics may take a while.