Open Access
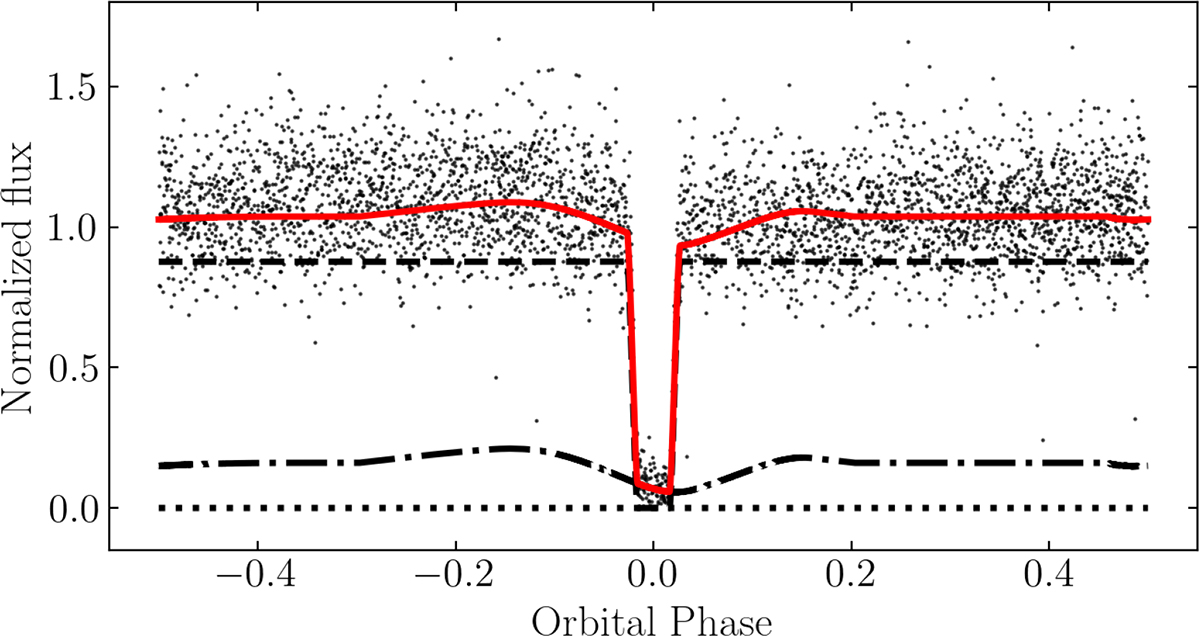
Fig. 4.
Download original image
Fitted UV light curve of ZTF J2252−05. The black points show the light curve binned into 3 s intervals. The best-fit model (red) includes contributions from the accreting WD (dashed line), the bright spot (dash-dotted line), and the accretion disc (dotted line). The residuals are shown below the light curve.
Current usage metrics show cumulative count of Article Views (full-text article views including HTML views, PDF and ePub downloads, according to the available data) and Abstracts Views on Vision4Press platform.
Data correspond to usage on the plateform after 2015. The current usage metrics is available 48-96 hours after online publication and is updated daily on week days.
Initial download of the metrics may take a while.