Open Access
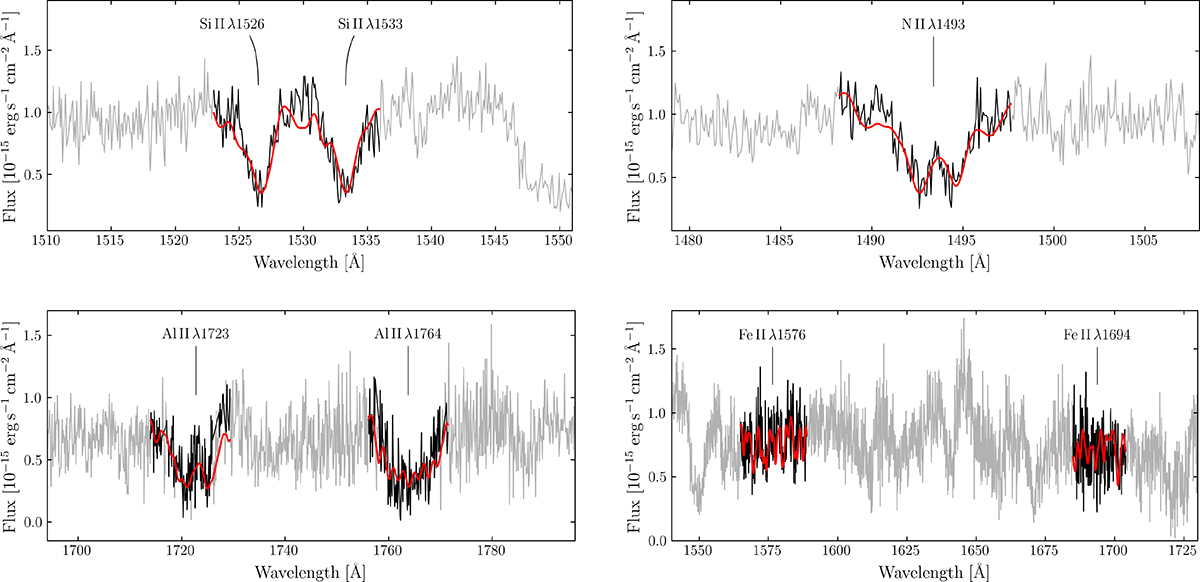
Fig. 7.
Download original image
Spectral fits for the individual elements Si, N, Fe, and Al (clockwise from the top left). This corresponds to step (c) described in Sect. 3.2.2. The identified absorption lines (black) are compared with the best-fitting models (red); spectral regions not included in the fit are shown in grey.
Current usage metrics show cumulative count of Article Views (full-text article views including HTML views, PDF and ePub downloads, according to the available data) and Abstracts Views on Vision4Press platform.
Data correspond to usage on the plateform after 2015. The current usage metrics is available 48-96 hours after online publication and is updated daily on week days.
Initial download of the metrics may take a while.