Fig. 9.
Download original image
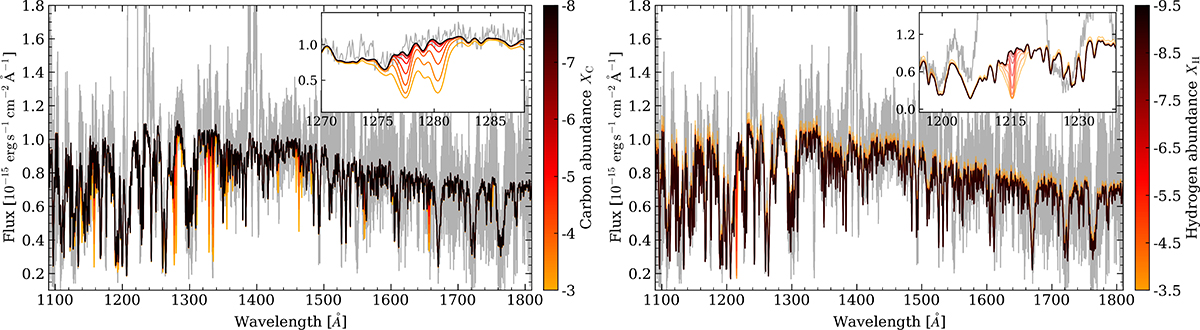
Synthetic spectra with varying carbon (left) and hydrogen (right) abundances overplotted on the observed spectrum (grey). Inset panels highlight the diagnostic regions. Left: Carbon abundances ranging from −8.0 to −3.0. The absence of C I lines near 1280 Å indicates XC < −5.0. Right: Hydrogen abundances from −9.5 to −3.0. Lyα is outshone by geocoronal emission, and no clear hydrogen diagnostic lines are present, leaving the hydrogen abundance unconstrained.
Current usage metrics show cumulative count of Article Views (full-text article views including HTML views, PDF and ePub downloads, according to the available data) and Abstracts Views on Vision4Press platform.
Data correspond to usage on the plateform after 2015. The current usage metrics is available 48-96 hours after online publication and is updated daily on week days.
Initial download of the metrics may take a while.