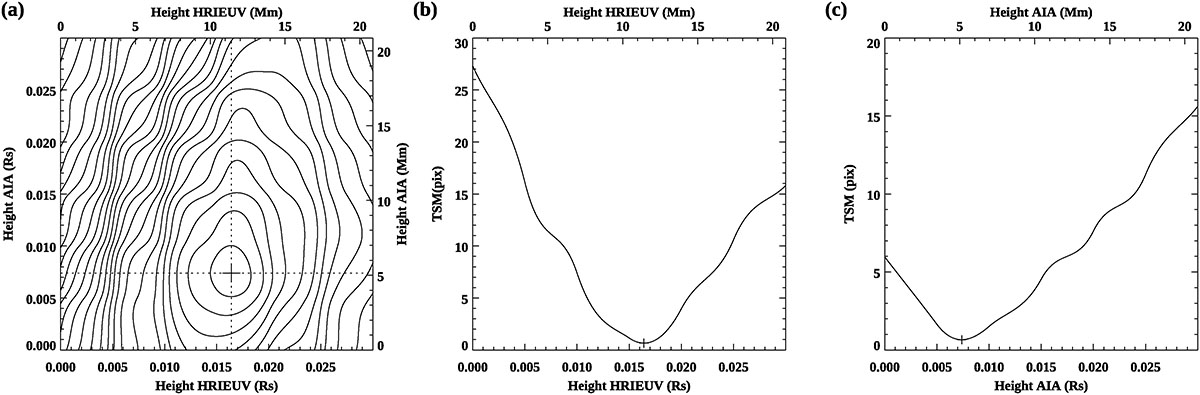
Fig. 2.
Download original image
(a) TSM or the magnitude of the translational pixel shift between the HRIEUV and AIA images after remapping to Carrington longitude-latitude coordinates as a function of height for HRIEUV (x-axis) and AIA (y-axis). These heights describe the surface we used to map to spherical coordinates, and they are shown in R⊙ and Mm. The cross shows the minimum of the surface. Panels (b) and (c) show TSM as a function of height for cuts passing through the minimum point, shown by the dotted horizontal and vertical lines in panel (a).
Current usage metrics show cumulative count of Article Views (full-text article views including HTML views, PDF and ePub downloads, according to the available data) and Abstracts Views on Vision4Press platform.
Data correspond to usage on the plateform after 2015. The current usage metrics is available 48-96 hours after online publication and is updated daily on week days.
Initial download of the metrics may take a while.