Fig. 3.
Download original image
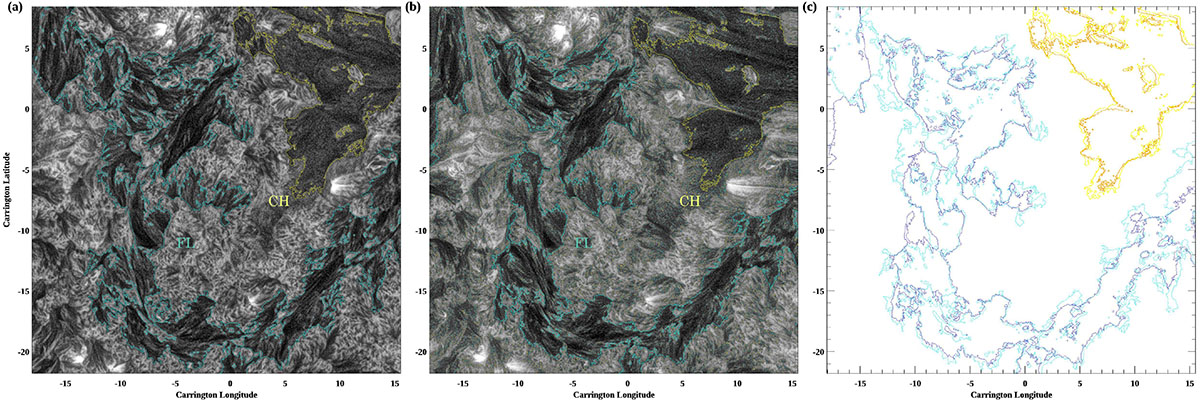
Region of interest as observed by (a) HRIEUV and (b) AIA. For display purposes, these images were processed using MGN. The images are mapped into Carrington coordinates to better compare the features observed from the two viewpoints. The yellow contour bounds a transequatorial CH, and the filament is labelled with a cyan contour. (c) A comparison of the segmented filament and CH regions from both instruments with the filament in dark blue contours (HRIEUV) and cyan (AIA), and the CH in orange (HRIEUV) and yellow (AIA).
Current usage metrics show cumulative count of Article Views (full-text article views including HTML views, PDF and ePub downloads, according to the available data) and Abstracts Views on Vision4Press platform.
Data correspond to usage on the plateform after 2015. The current usage metrics is available 48-96 hours after online publication and is updated daily on week days.
Initial download of the metrics may take a while.