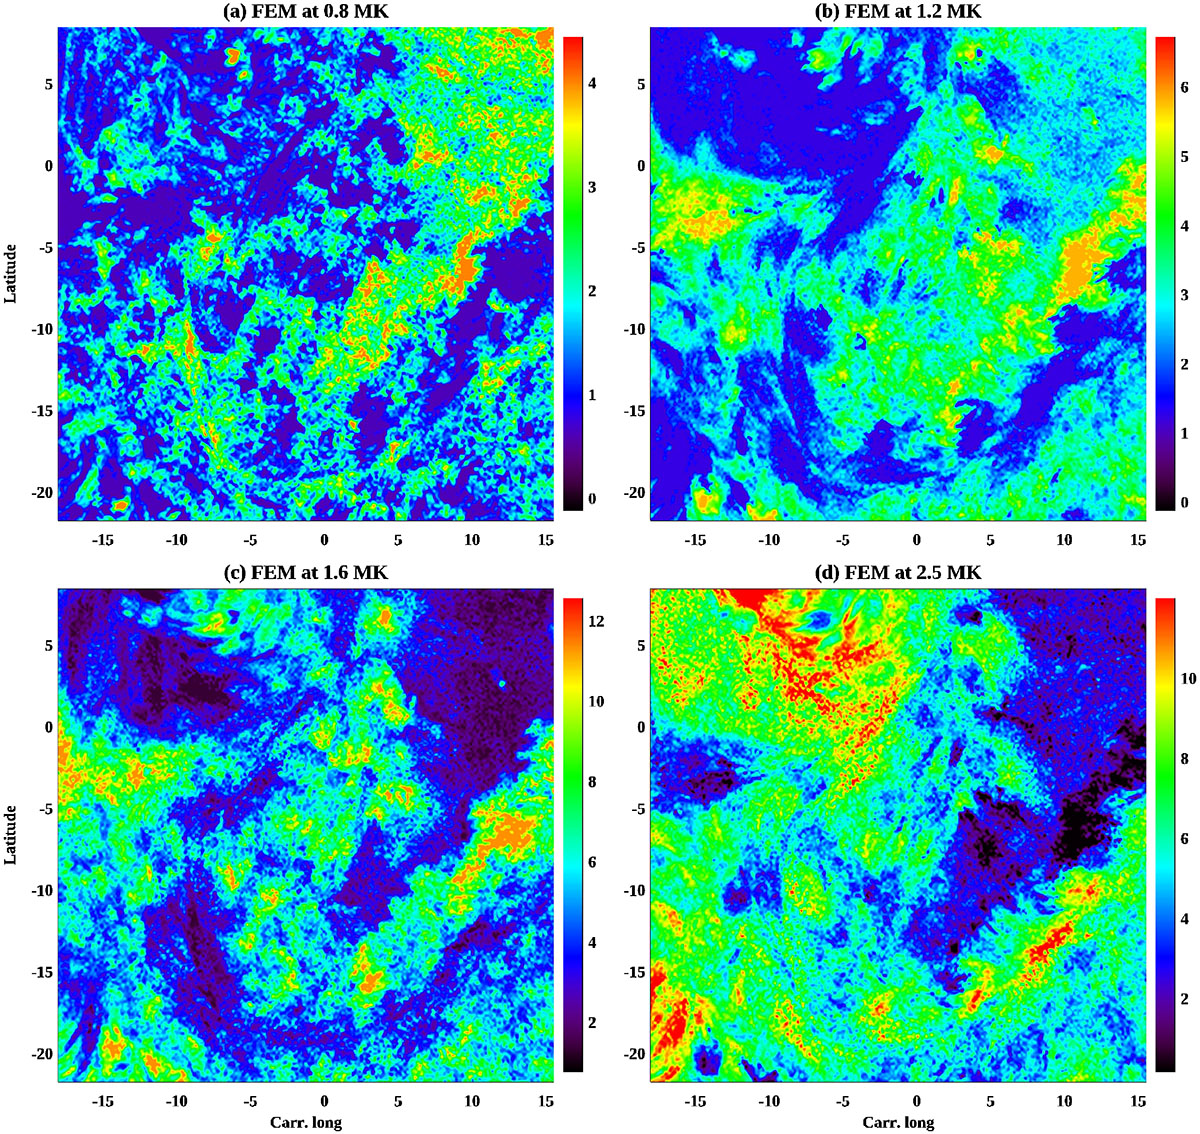
Fig. 4.
Download original image
Results of a Differential Emission Measure (DEM) analysis of the ROI at four selected temperatures (a) 0.8, (b) 1.2, (c) 1.6, and (d) 2.5 MK. These plots show the Fractional Emission Measure (FEM), which is the emission at a given temperature divided by the total emission (integrated over all temperatures) at that pixel expressed as a percentage, as shown in the colour bars.
Current usage metrics show cumulative count of Article Views (full-text article views including HTML views, PDF and ePub downloads, according to the available data) and Abstracts Views on Vision4Press platform.
Data correspond to usage on the plateform after 2015. The current usage metrics is available 48-96 hours after online publication and is updated daily on week days.
Initial download of the metrics may take a while.