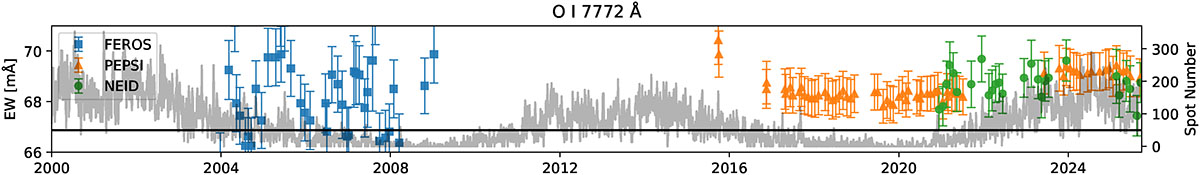
Fig. 2.
Download original image
Measured EW of the O I 7772 Å line with FEROS (blue), PEPSI (orange), and NEID (green), including corresponding uncertainties. The gray curve shows the sunspot number as an activity reference, and the horizontal black line at 50 distinguishes active from quiet times. The corresponding plots for the three remaining lines are shown in Fig. B.1.
Current usage metrics show cumulative count of Article Views (full-text article views including HTML views, PDF and ePub downloads, according to the available data) and Abstracts Views on Vision4Press platform.
Data correspond to usage on the plateform after 2015. The current usage metrics is available 48-96 hours after online publication and is updated daily on week days.
Initial download of the metrics may take a while.