Fig. 4
Download original image
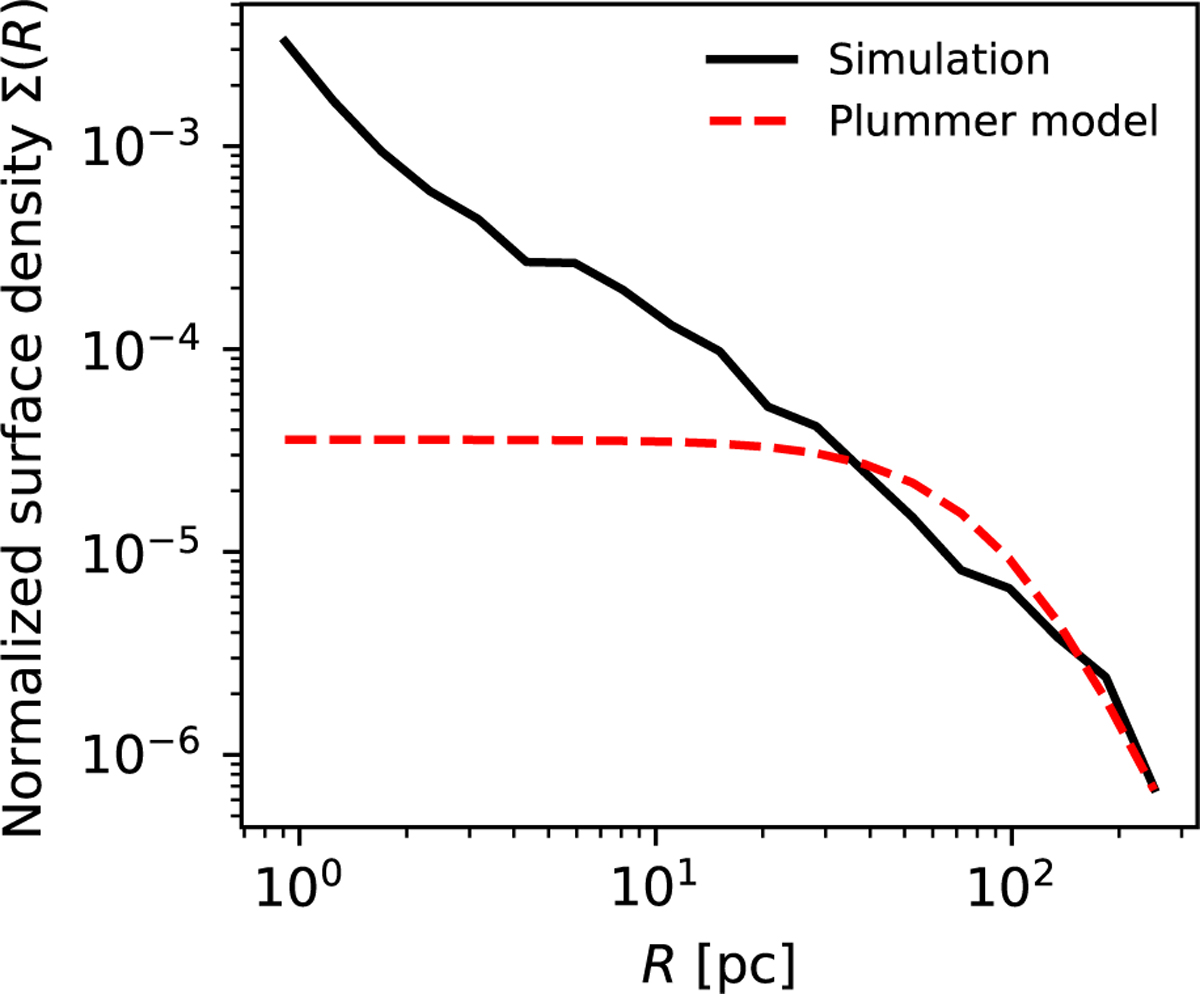
Normalized projected stellar surface density profile, Σ(R), of the simulated system at the final snapshot for a model with RPl=500 pc and rfrac = 100 pc. The solid black line shows the normalized surface density obtained from the simulation after projecting the normalization on the x−z plane. The dashed red line corresponds to a normalized projected Plummer profile with the same scale radius, shown for reference. No observational surface density profile is available for UMa II; therefore, the comparison is restricted to idealized models. The deviations from a Plummer profile indicate that this functional form does not provide an optimal description of the final stellar distribution in our simulations.
Current usage metrics show cumulative count of Article Views (full-text article views including HTML views, PDF and ePub downloads, according to the available data) and Abstracts Views on Vision4Press platform.
Data correspond to usage on the plateform after 2015. The current usage metrics is available 48-96 hours after online publication and is updated daily on week days.
Initial download of the metrics may take a while.