Fig. 6
Download original image
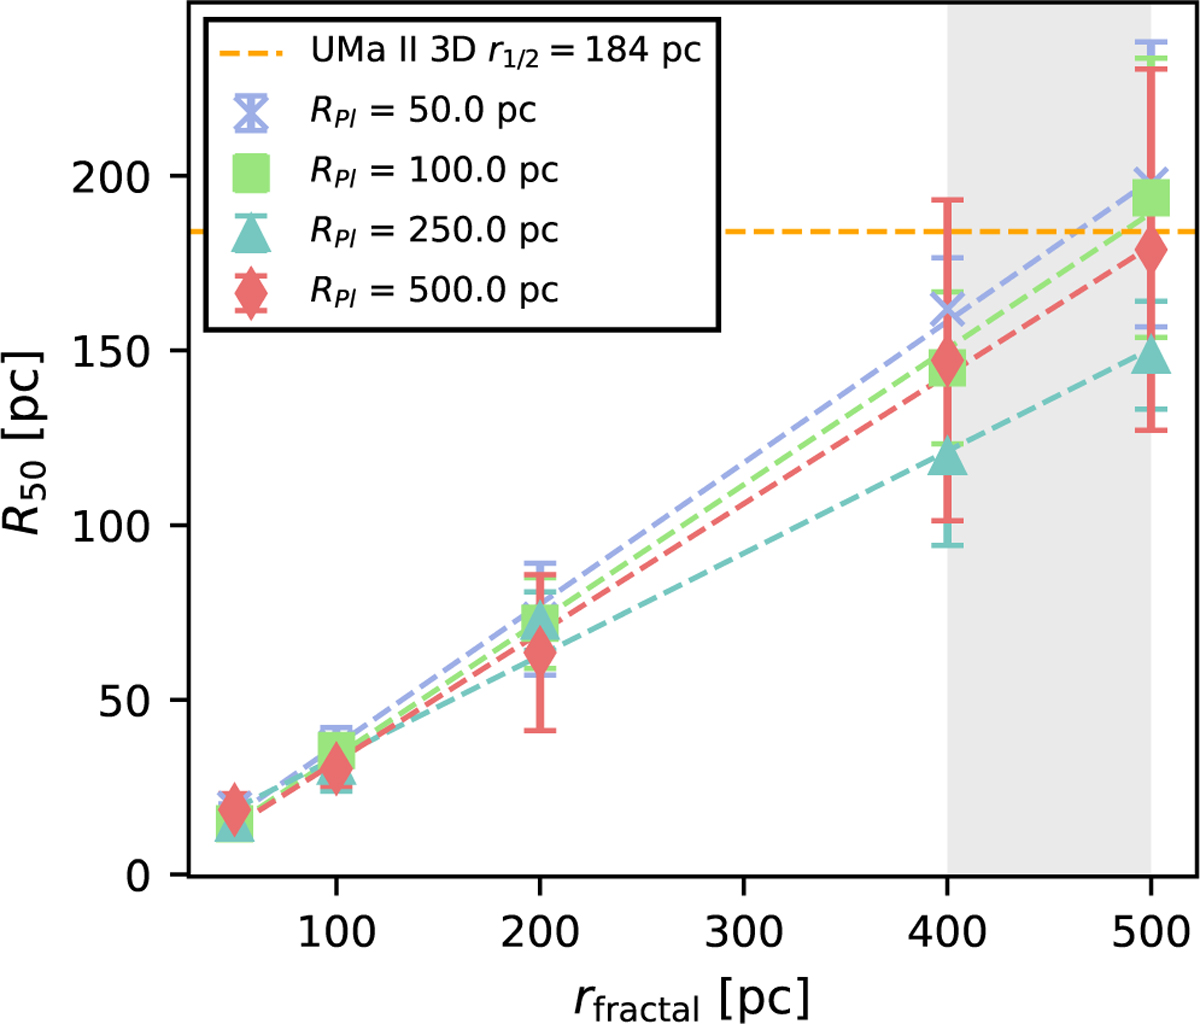
Half-mass radius compared with initial fractal scale length for each Plummer radius. The colored figures represent the RPl = 50, 100, 250, and 500 pc. The colored dotted lines set the fit for each RPl. The dotted horizontal yellow line is the 3D half-light radius of UMa II (Wolf et al. 2010). The vertical gray rectangle represents the range of rfrac in which the UMa 3D r1/2 can be reached. Data obtained from Table 2.
Current usage metrics show cumulative count of Article Views (full-text article views including HTML views, PDF and ePub downloads, according to the available data) and Abstracts Views on Vision4Press platform.
Data correspond to usage on the plateform after 2015. The current usage metrics is available 48-96 hours after online publication and is updated daily on week days.
Initial download of the metrics may take a while.