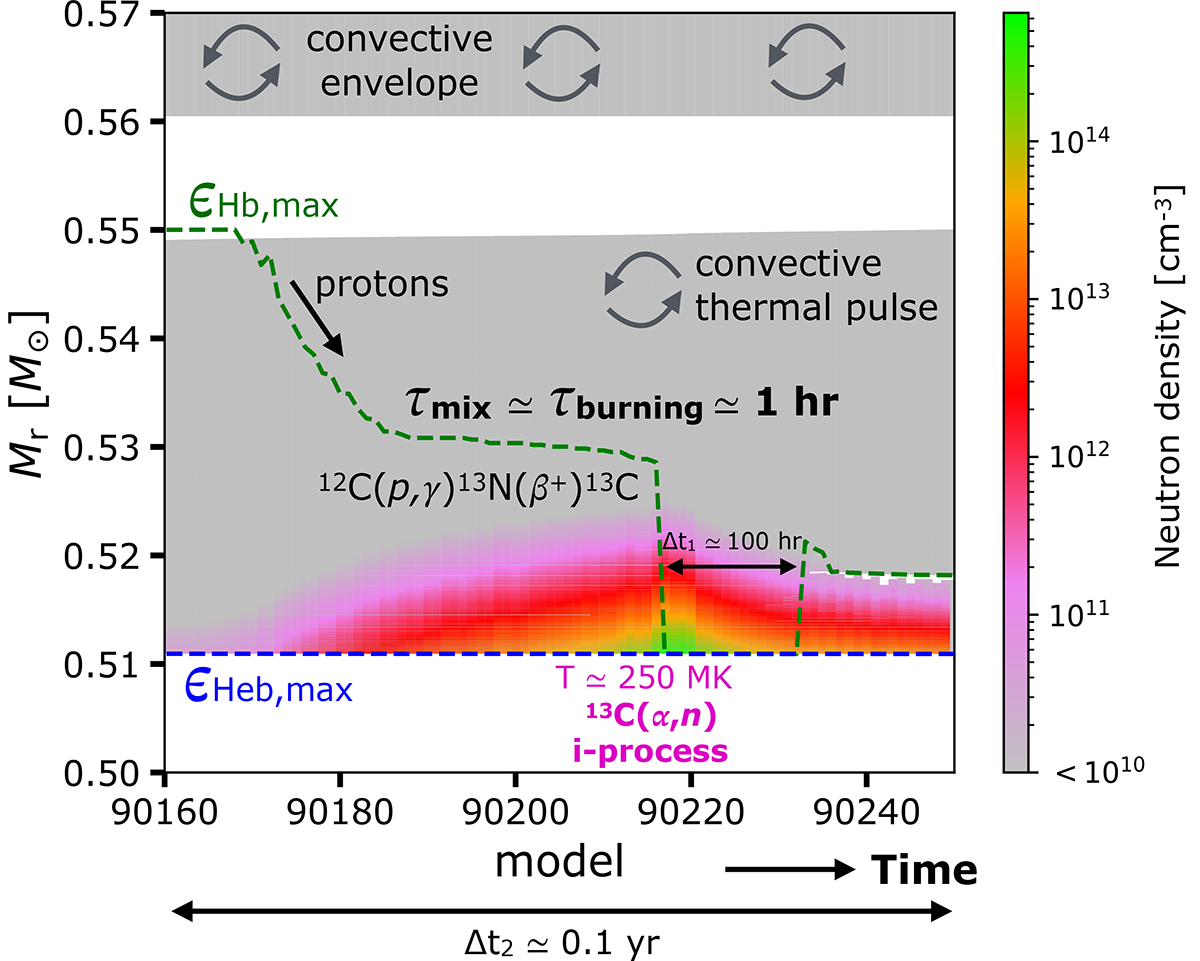
Fig. 1.
Download original image
Kippenhahn diagram illustrating key features of a PIE in a non-rotating 1 M⊙, [Fe/H] = −2.5 AGB model, computed with the STAREVOL code. Grey regions indicate convective zones. The dashed green (blue) line marks the location of maximum H-burning (He-burning) energy. The colour map shows the neutron density. The time between the peak neutron density and the split is Δt1 ≃ 100 h, while the total duration of the sequence shown is Δt2 ≃ 0.1 yr.
Current usage metrics show cumulative count of Article Views (full-text article views including HTML views, PDF and ePub downloads, according to the available data) and Abstracts Views on Vision4Press platform.
Data correspond to usage on the plateform after 2015. The current usage metrics is available 48-96 hours after online publication and is updated daily on week days.
Initial download of the metrics may take a while.