Fig. 2.
Download original image
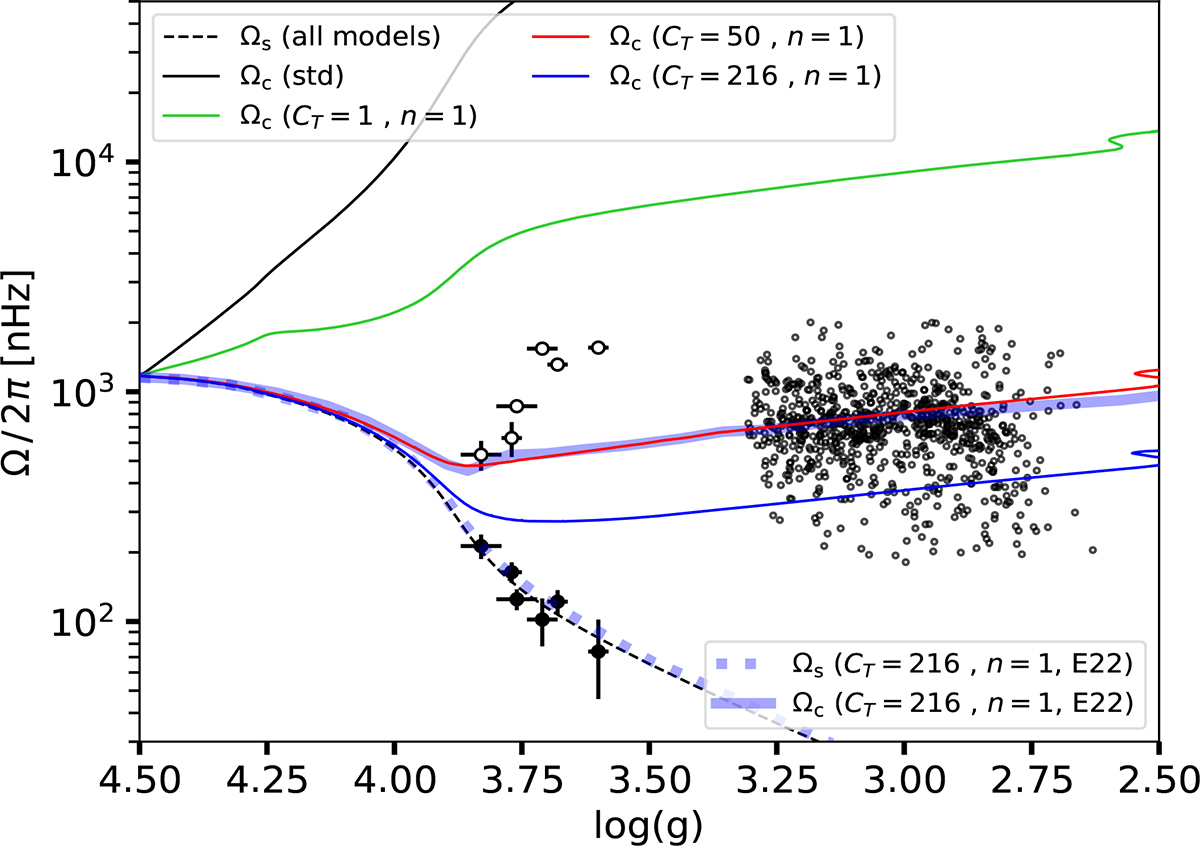
Surface (dashed lines, Ωs) and core (solid lines, Ωc) rotation rates as a function of surface gravity for 1.1 M⊙, solar-metallicity models with vini = 5 km s−1. Models are computed without (black) and with the Tayler instability, using n = 1 and various values of the calibration constant CT (green, red, and blue). The thick blue lines show the surface and core rotation of the 1.1 M⊙, solar-metallicity model from Eggenberger et al. (2022) (E22) computed with GENEC (n = 1, CT = 216). Large black-filled (open) symbols indicate observed surface (core) rotation rates of sub-giant stars (Deheuvels et al. 2014), while the smaller black dots show core rotation rates of RGB stars (Gehan et al. 2018).
Current usage metrics show cumulative count of Article Views (full-text article views including HTML views, PDF and ePub downloads, according to the available data) and Abstracts Views on Vision4Press platform.
Data correspond to usage on the plateform after 2015. The current usage metrics is available 48-96 hours after online publication and is updated daily on week days.
Initial download of the metrics may take a while.