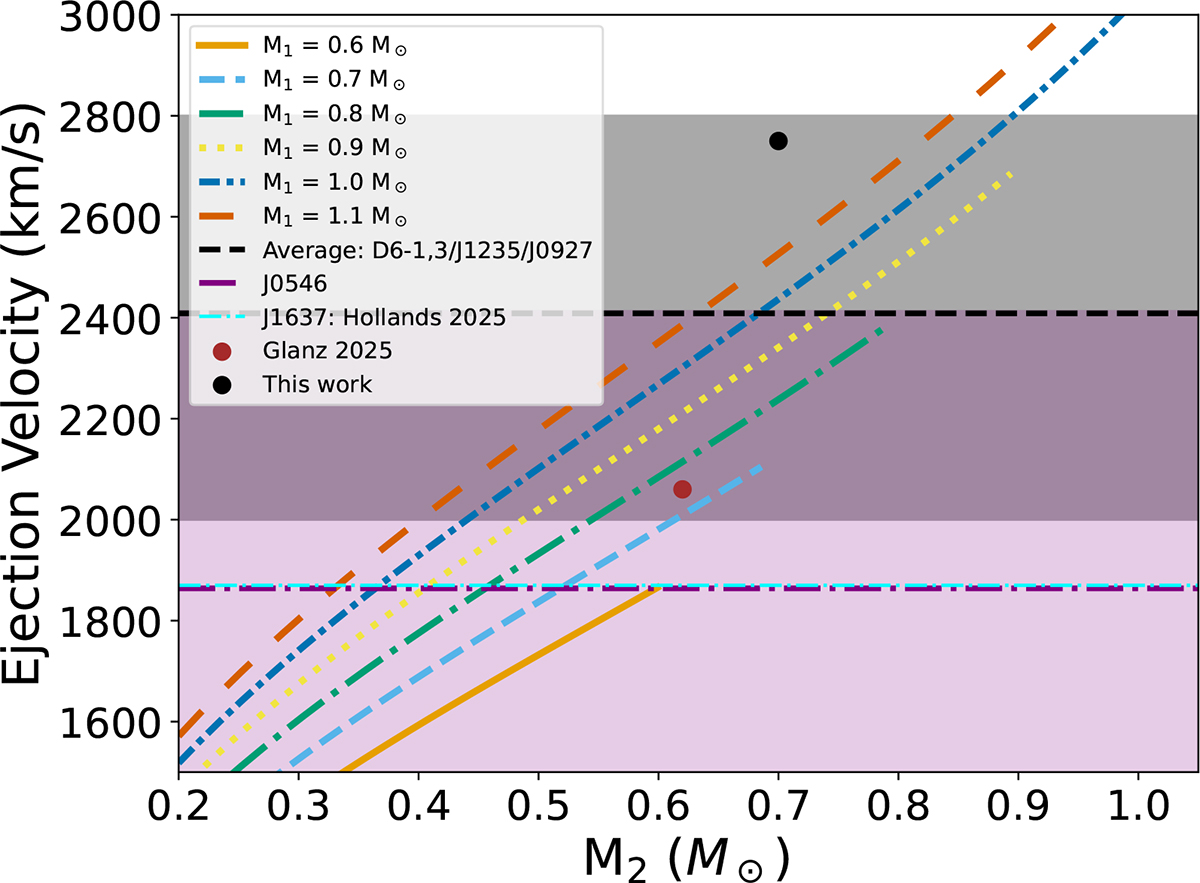
Fig. 13.
Download original image
Orbital velocities for multiple primary and secondary masses (the lines correspond to different primaries). The velocity is calculated assuming the circularisation radius is reached before explosion. Two simulation values are plotted as circles. The black region shows min and max ejection velocities for D6-1,3, J1235, and J0927. Cyan and purple lines (and the corresponding shaded regions) show the values for J1637 and J0546, respectively, both matching slightly lower mass white dwarf secondaries.
Current usage metrics show cumulative count of Article Views (full-text article views including HTML views, PDF and ePub downloads, according to the available data) and Abstracts Views on Vision4Press platform.
Data correspond to usage on the plateform after 2015. The current usage metrics is available 48-96 hours after online publication and is updated daily on week days.
Initial download of the metrics may take a while.