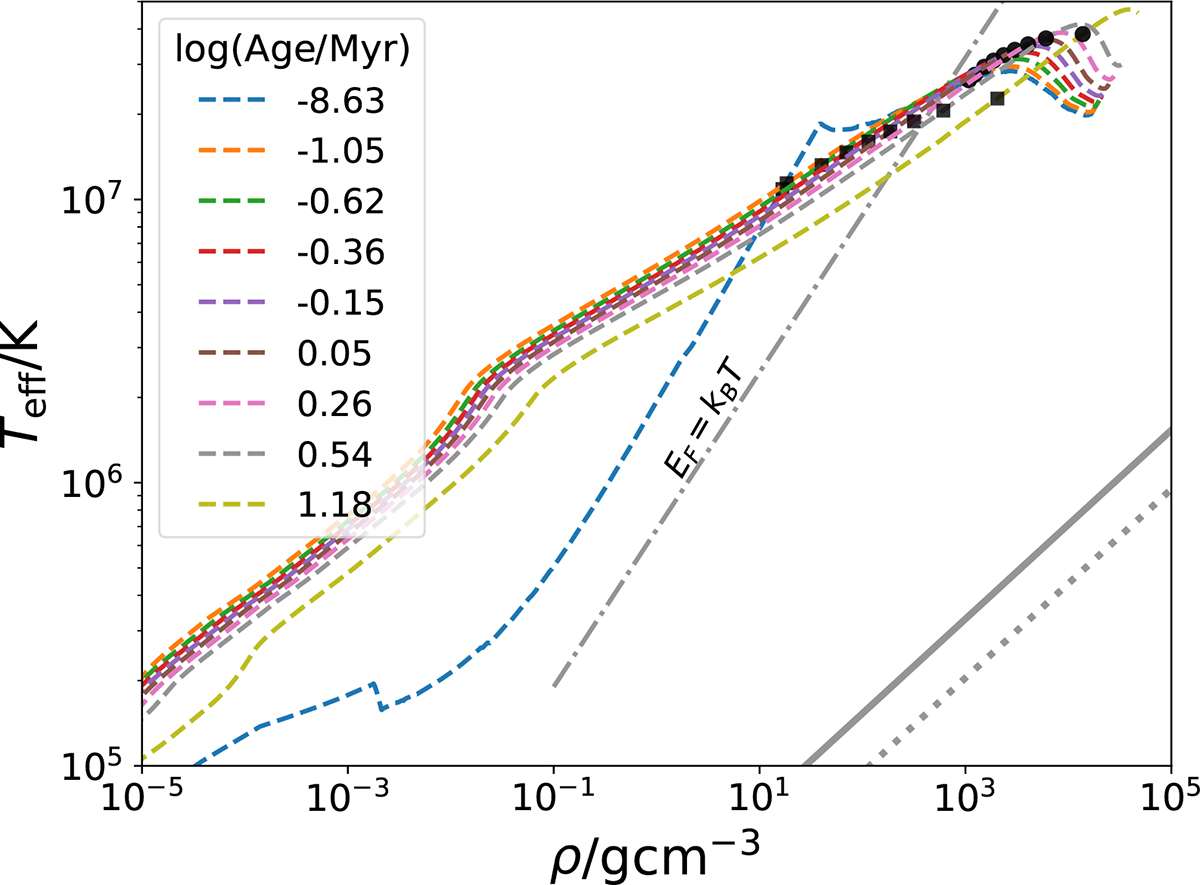
Fig. 5.
Download original image
Structural profile of 0.154 M⊙ model as a function of its age. The puffing up and later contraction of the star are seen here. The black circles (black squares) represent 50% (90%) of the stellar mass. The dashed-dotted grey line is the degeneracy limit above which gas pressure dominates. The two grey lines in the bottom right are the crystallisation limit for carbon and oxygen. Dotted regions are convective.
Current usage metrics show cumulative count of Article Views (full-text article views including HTML views, PDF and ePub downloads, according to the available data) and Abstracts Views on Vision4Press platform.
Data correspond to usage on the plateform after 2015. The current usage metrics is available 48-96 hours after online publication and is updated daily on week days.
Initial download of the metrics may take a while.