Open Access
Fig. 2
Download original image
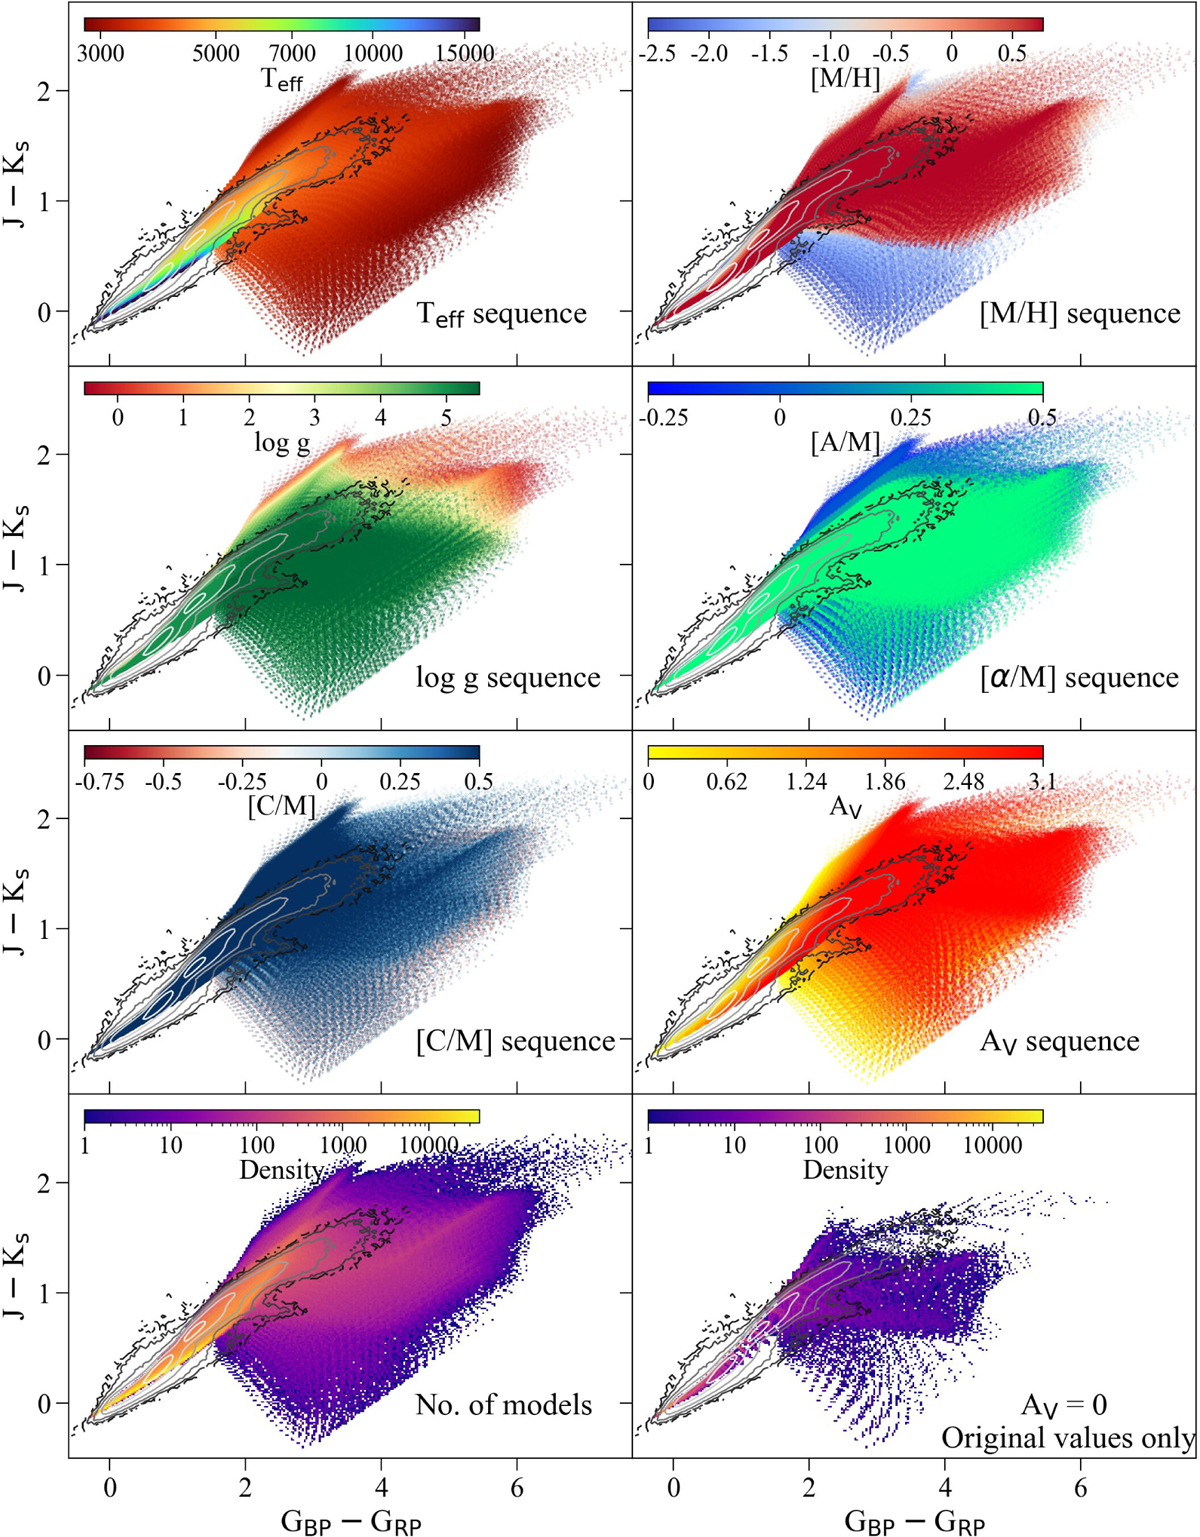
J-Ks vs. GBP-GRP color-color diagram. The contoured area represents stars observed by both Gaia and 2MASS (see Section 3.1 for further details). Each panel is color-coded by a different parameter indicated in the panels themselves.
Current usage metrics show cumulative count of Article Views (full-text article views including HTML views, PDF and ePub downloads, according to the available data) and Abstracts Views on Vision4Press platform.
Data correspond to usage on the plateform after 2015. The current usage metrics is available 48-96 hours after online publication and is updated daily on week days.
Initial download of the metrics may take a while.