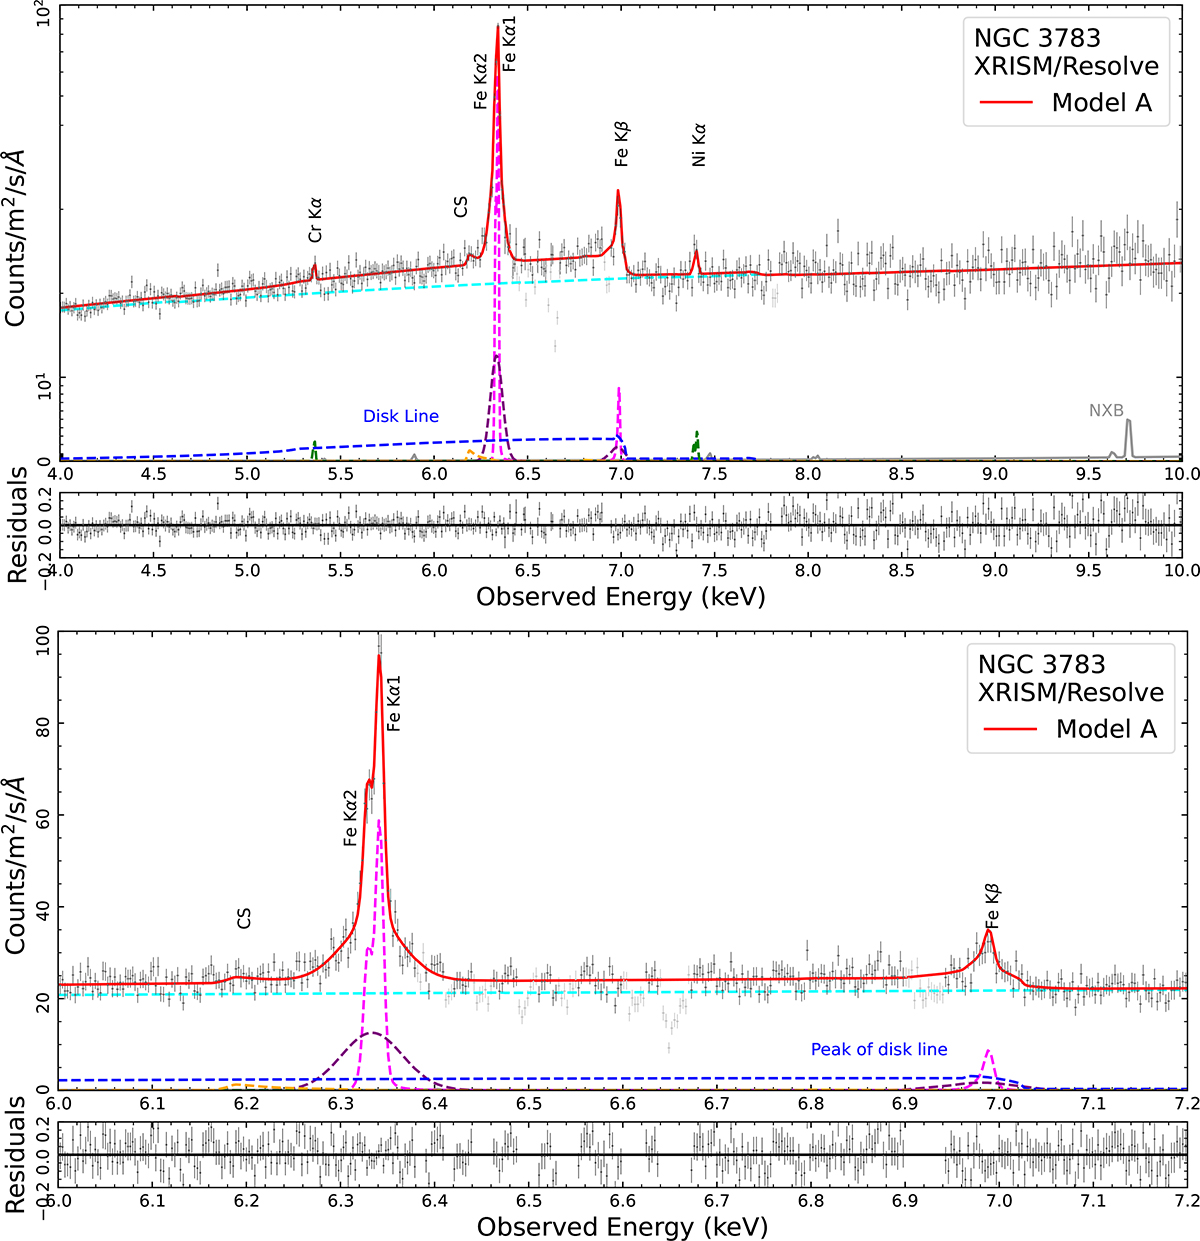
Fig. 4.
Download original image
XRISM/Resolve time-averaged spectrum of NGC 3783 with the best-fitting model shown as a solid red line. Top two panels: Resolve background-subtracted spectrum with individual model components and the corresponding fit residuals. The fit residuals are defined as (data − model)/model. In our fitting, we used all data points in black and excluded the strong absorption line data points (in grey) when the modelling continuum and emission lines independently. For visualisation purposes, the spectrum in the top panel is additionally binned up to 8 eV. Bottom two panels: Close-up view of the Fe K band and its fit residuals at the model optimal bin size of 2 eV. In both panels, the strongest emission features are labelled. The individual components are plotted with dashed lines representing the power law (cyan), the narrowest (magenta) and intermediate (purple) iron components, the relativistic iron line (blue), the CS (orange), and Cr Kα and Ni Kα (green). The background model is depicted by the grey curve.
Current usage metrics show cumulative count of Article Views (full-text article views including HTML views, PDF and ePub downloads, according to the available data) and Abstracts Views on Vision4Press platform.
Data correspond to usage on the plateform after 2015. The current usage metrics is available 48-96 hours after online publication and is updated daily on week days.
Initial download of the metrics may take a while.