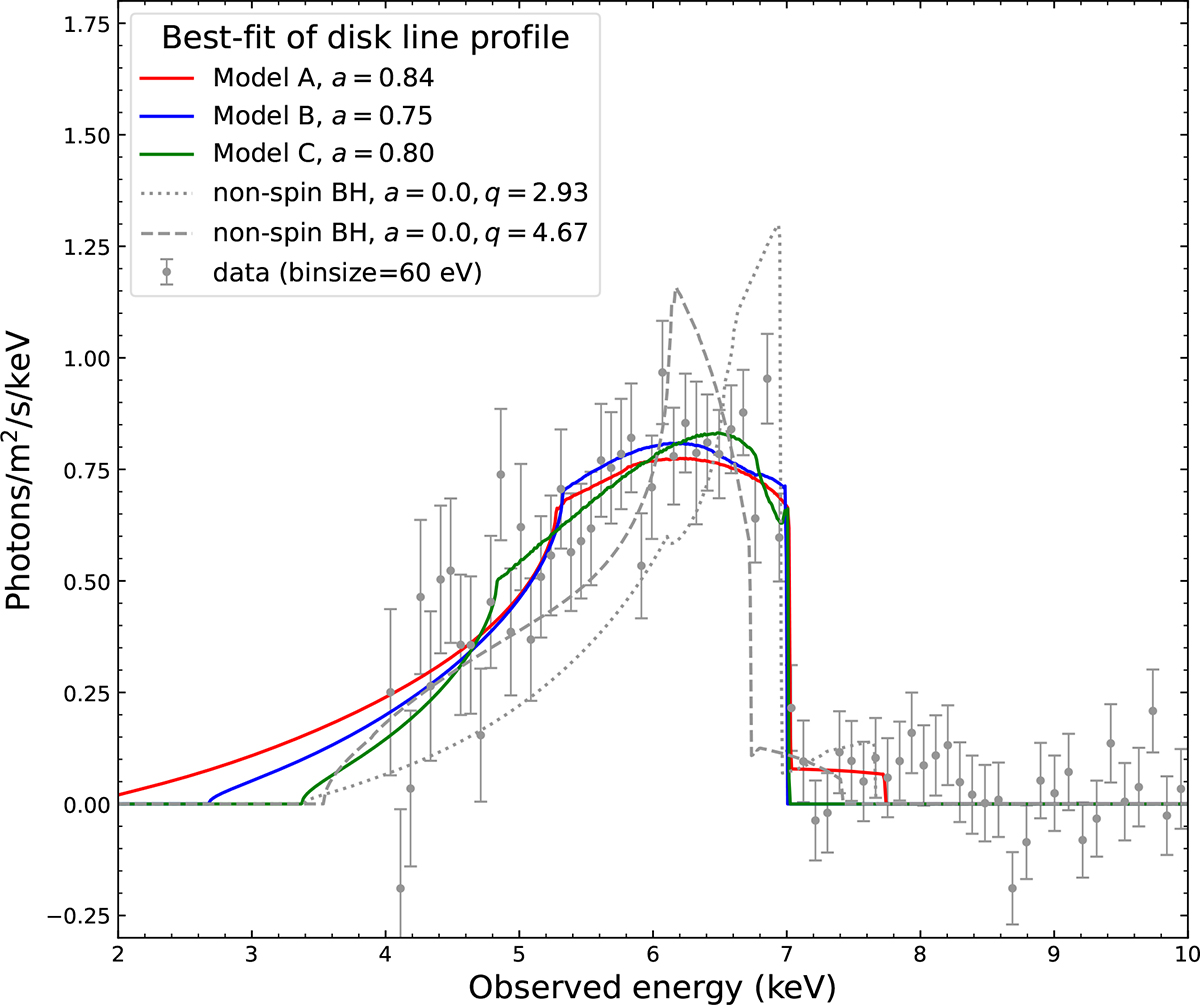
Fig. 6.
Download original image
Modelling relativistic iron line profiles. The red, blue, and green curves represent the best-fit relativistic iron line profiles of Models A, B, and C, respectively. The dotted and dashed grey lines are non-spin BH solutions with different emissivity slopes. The former is derived from a grid search based on Table A.2, and the latter is one of solutions shown in Fig. 9. Both profiles correspond to the minimum C-statistic value for a non-spinning BH case. The grey data points represent the residuals of Model A (data − model) excluding the relativistic iron line, binned to 60 eV.
Current usage metrics show cumulative count of Article Views (full-text article views including HTML views, PDF and ePub downloads, according to the available data) and Abstracts Views on Vision4Press platform.
Data correspond to usage on the plateform after 2015. The current usage metrics is available 48-96 hours after online publication and is updated daily on week days.
Initial download of the metrics may take a while.