Fig. 1
Download original image
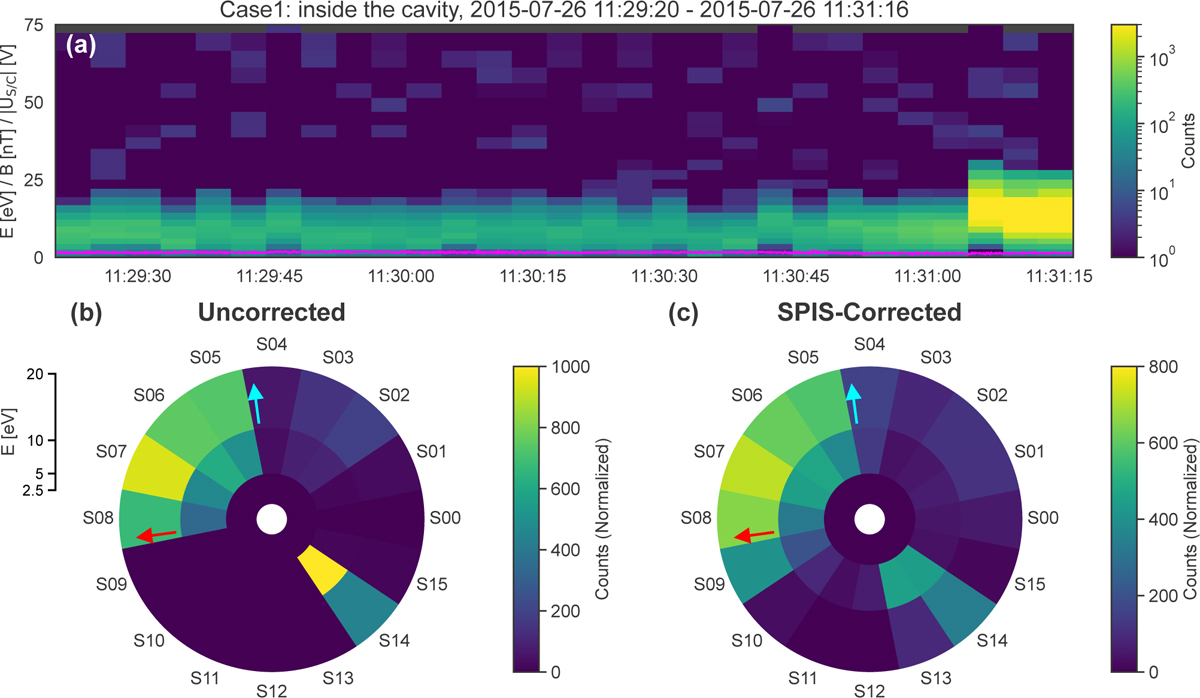
Example case of counter-streaming ions observed by RPC-ICA inside the diamagnetic cavity on 2015 July 26. Note that the energy scale in all panels has been corrected using the lower energy cut-off method, as detailed in Section 2.3. (a) Energy-time spectrogram of ions. The magenta line indicates the total magnetic field strength. (b) The corresponding sector polar plot of ion counts, showing the instrument’s raw directional measurements. (c) The same polar plot after a directional correction has been applied using the spacecraft plasma interaction software (SPIS; Bergman et al. 2020a,b). In the polar plots (b, c), the polar axis represents the instrument’s viewing sector, while the radial axis corresponds to three re-binned energy ranges (2.5–5 eV, 5–10 eV, and 10–20 eV). The color scale indicates the ion counts normalized by the observation time for energy interval. Data from the contaminated sector 0 have been removed, and sector 13 is inactive. The blue and red arrows point toward the average directions to the comet and the Sun, respectively.
Current usage metrics show cumulative count of Article Views (full-text article views including HTML views, PDF and ePub downloads, according to the available data) and Abstracts Views on Vision4Press platform.
Data correspond to usage on the plateform after 2015. The current usage metrics is available 48-96 hours after online publication and is updated daily on week days.
Initial download of the metrics may take a while.