Fig. 4
Download original image
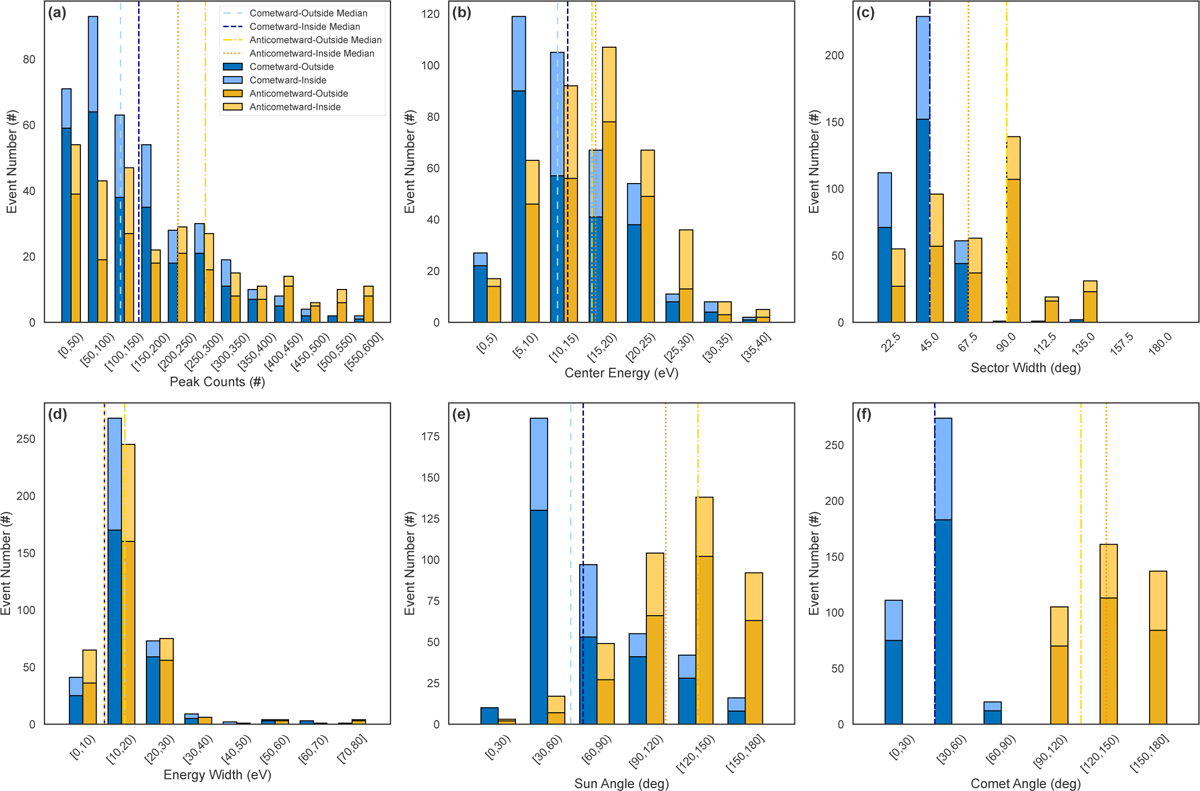
Same as Fig. 3, but for the results derived from standard-resolution RPC-ICA data. The histograms show the statistical distributions of the six parameters for cometward (blue) and anticometward (orange) ion flows, observed inside (light shades) and outside (dark shades) the diamagnetic cavity. The median of each distribution is marked by a corresponding dashed line.
Current usage metrics show cumulative count of Article Views (full-text article views including HTML views, PDF and ePub downloads, according to the available data) and Abstracts Views on Vision4Press platform.
Data correspond to usage on the plateform after 2015. The current usage metrics is available 48-96 hours after online publication and is updated daily on week days.
Initial download of the metrics may take a while.