Open Access
Fig. B.1
Download original image
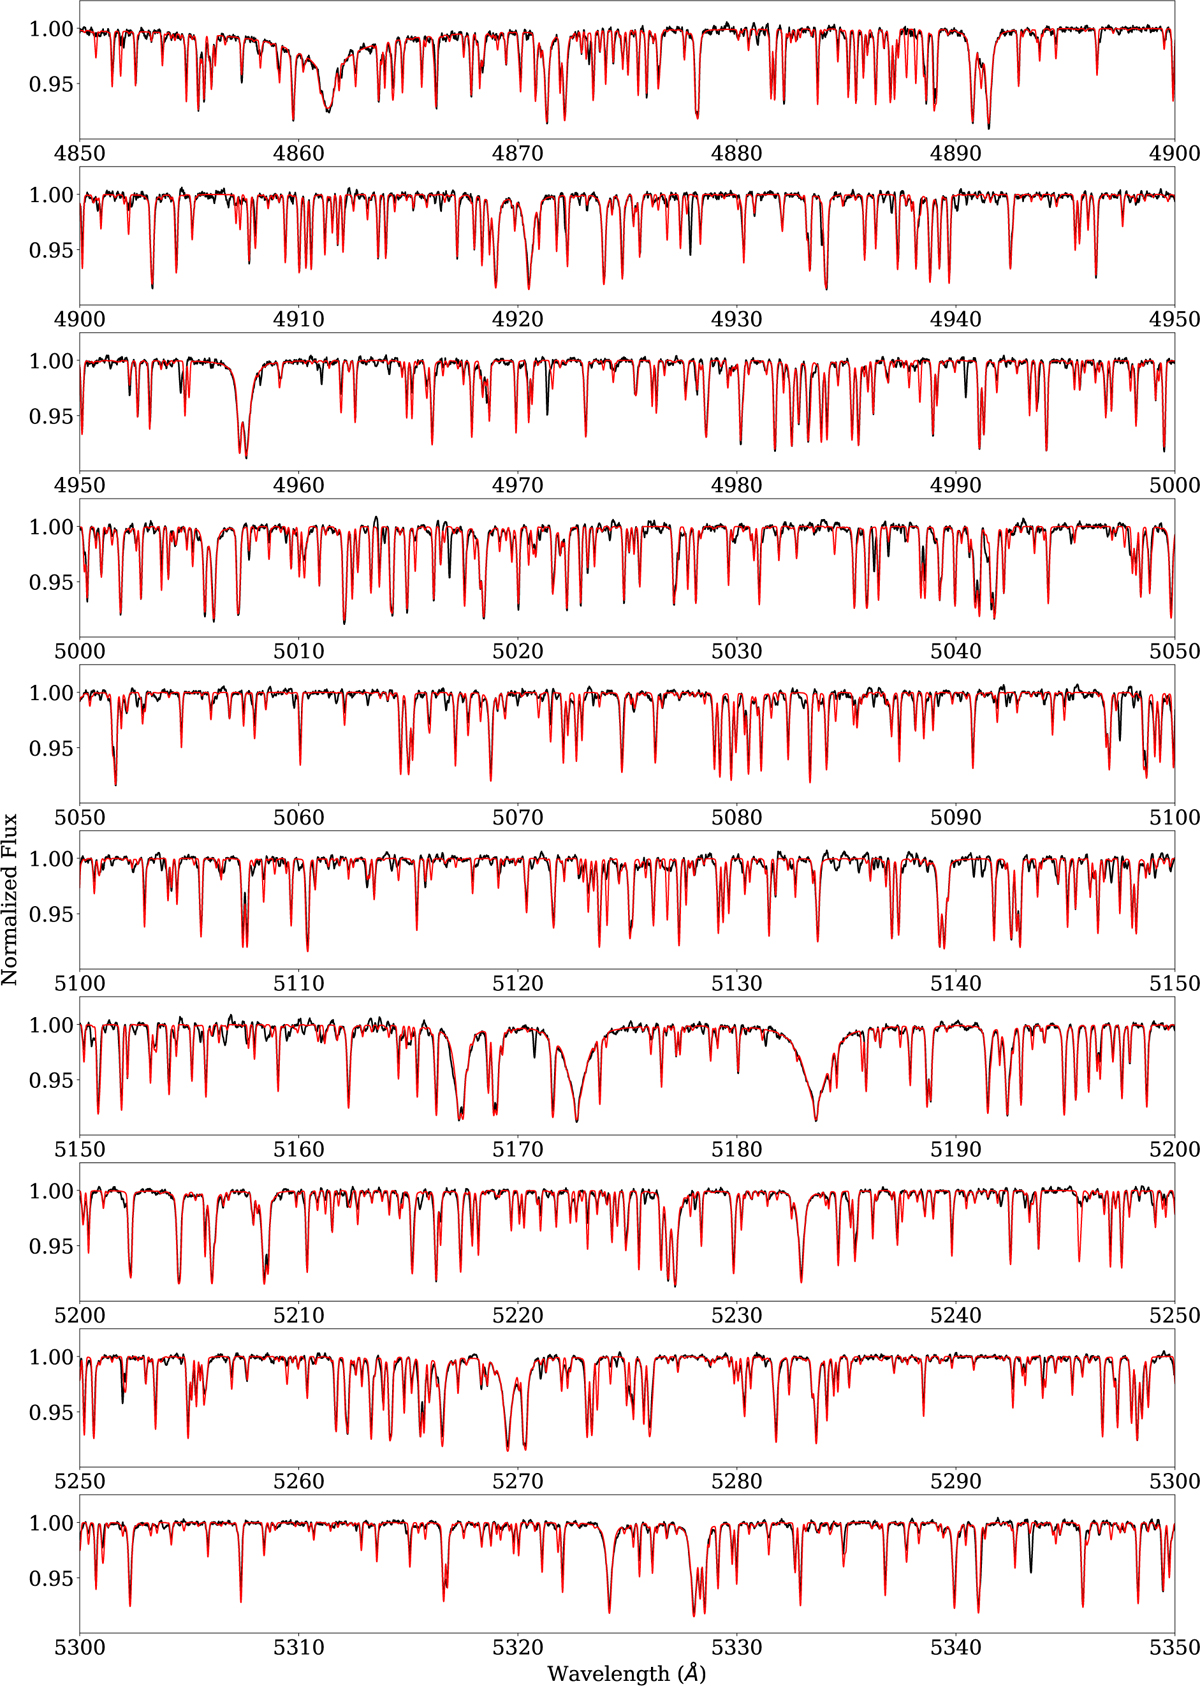
Mean spectrum of the secondary star in the CD-III range of PEPSI (4800-5400 Å). The black line is the observation, the red line is a model fit based on ParSES and MARCS.
Current usage metrics show cumulative count of Article Views (full-text article views including HTML views, PDF and ePub downloads, according to the available data) and Abstracts Views on Vision4Press platform.
Data correspond to usage on the plateform after 2015. The current usage metrics is available 48-96 hours after online publication and is updated daily on week days.
Initial download of the metrics may take a while.