Open Access
Fig. B.2
Download original image
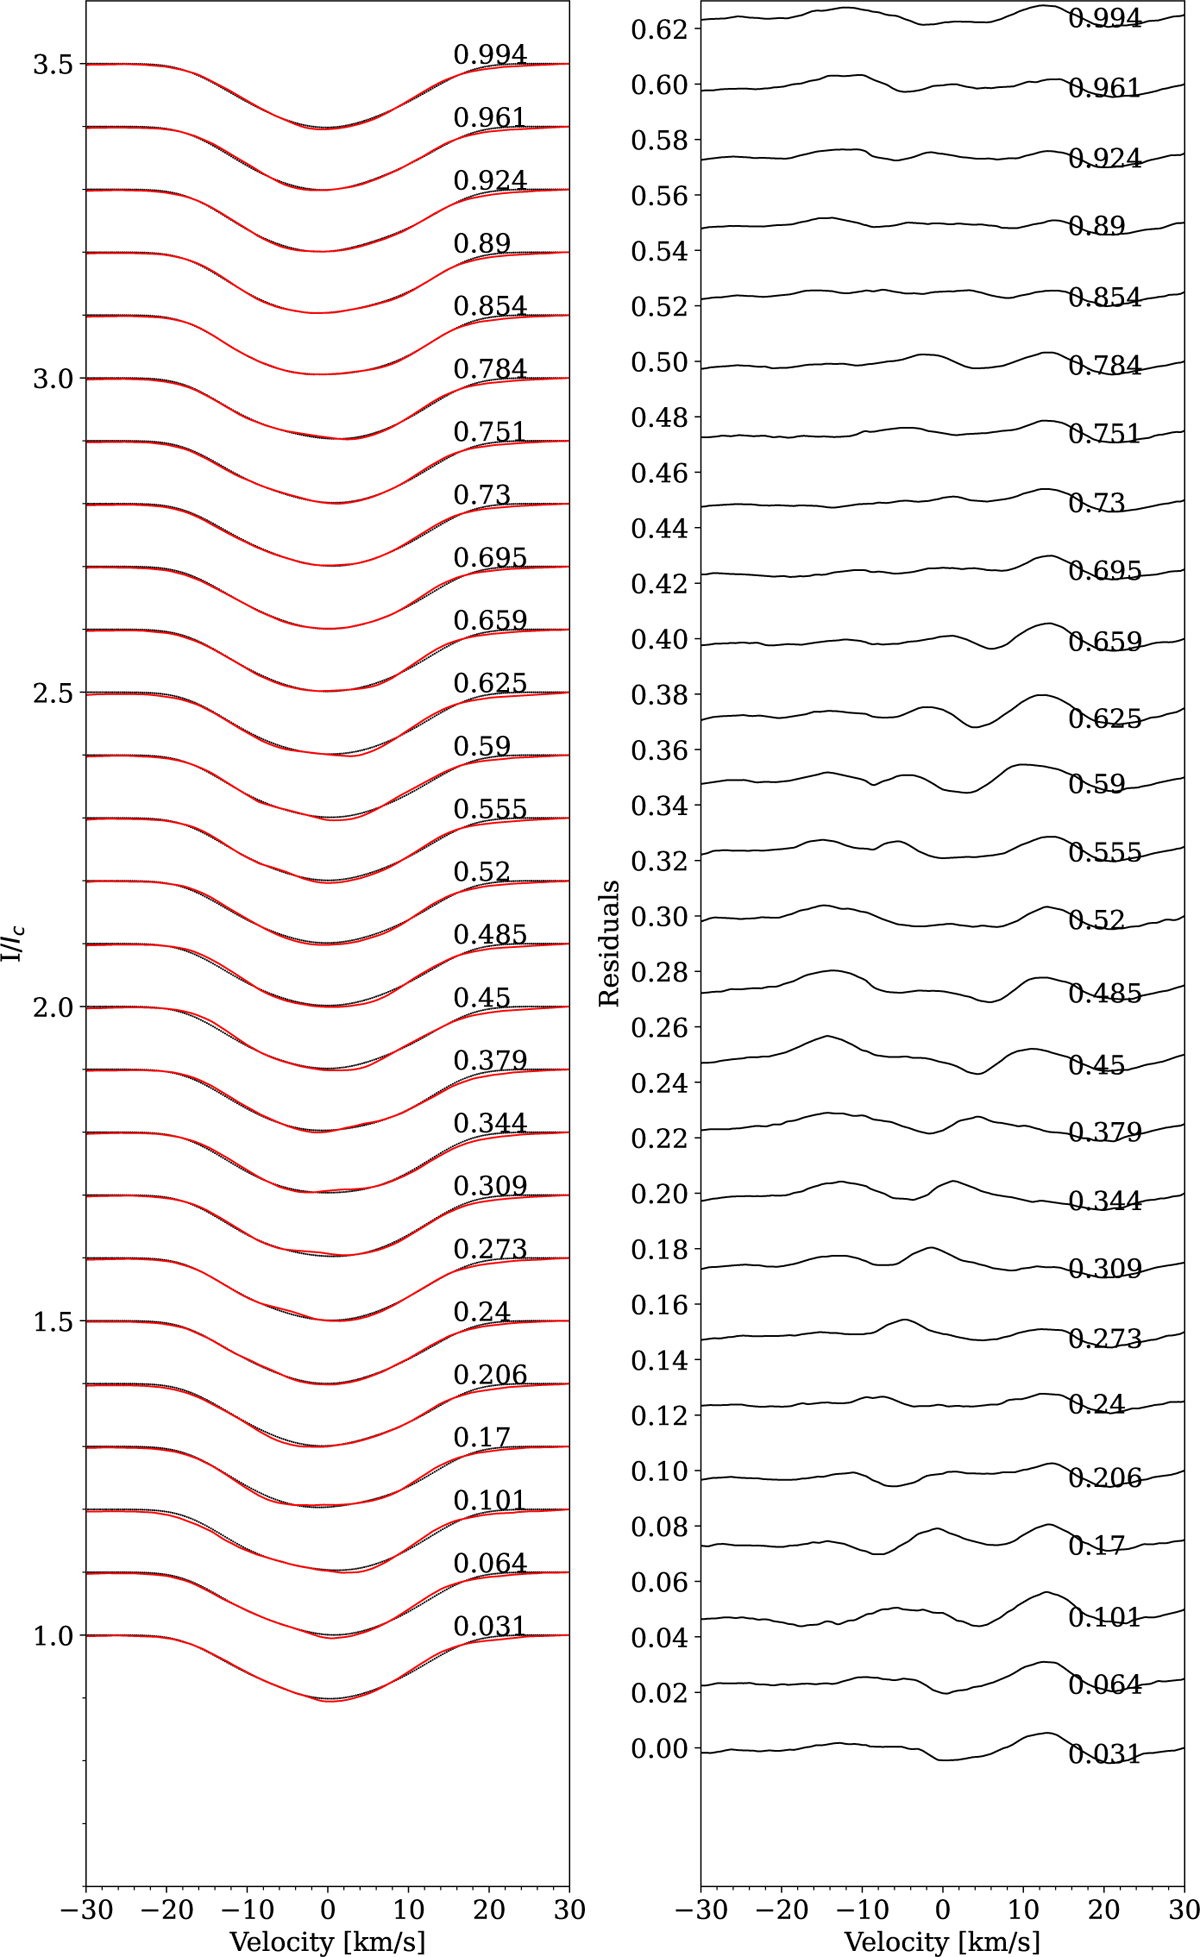
LSD profiles for the iMAP inversions. On the left panel the observed line profiles (red line) are compared with the fitted synthetic profiles (black dotted lines). The corresponding residuals are plotted in the right panel. Numbers on the right side of each panel indicate the rotational phase.
Current usage metrics show cumulative count of Article Views (full-text article views including HTML views, PDF and ePub downloads, according to the available data) and Abstracts Views on Vision4Press platform.
Data correspond to usage on the plateform after 2015. The current usage metrics is available 48-96 hours after online publication and is updated daily on week days.
Initial download of the metrics may take a while.