Open Access
Fig. 7
Download original image
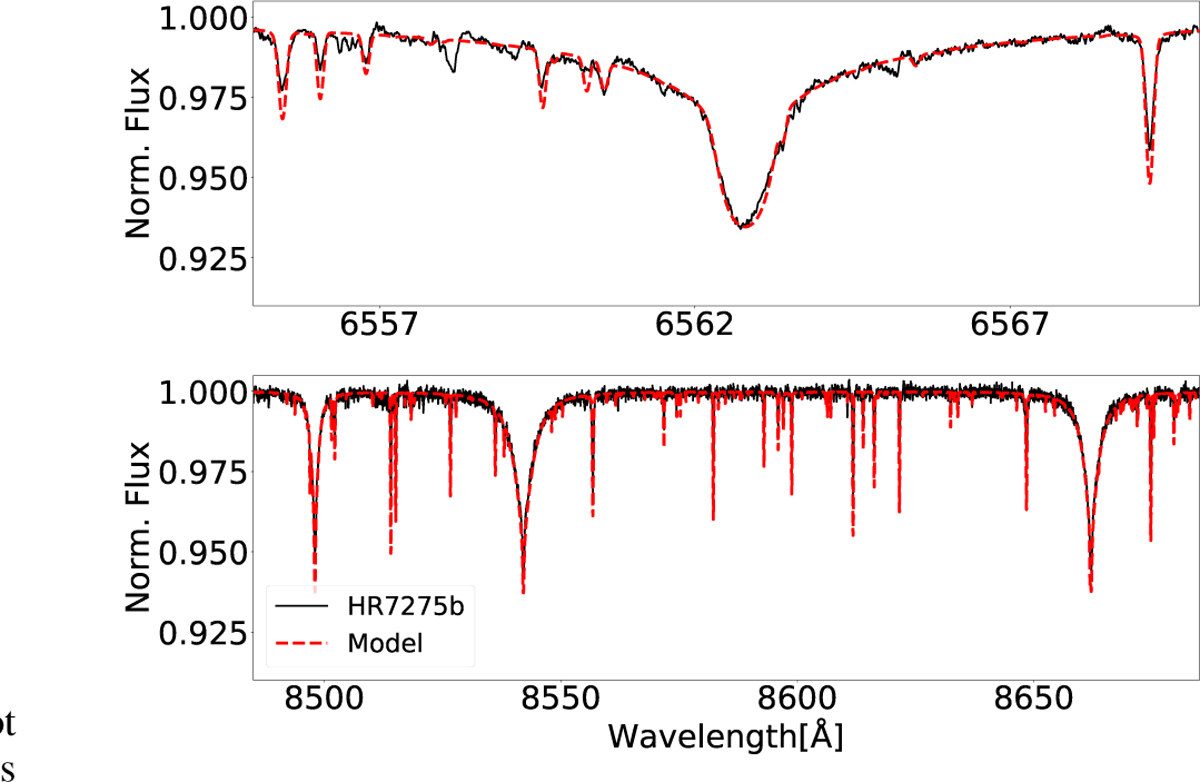
Disentangled spectrum of HR7275b near Hα (upper panel) and the Ca II IRT region (lower panel). The observed spectrum is shown as a black line, and the model is indicated by a dashed red line.
Current usage metrics show cumulative count of Article Views (full-text article views including HTML views, PDF and ePub downloads, according to the available data) and Abstracts Views on Vision4Press platform.
Data correspond to usage on the plateform after 2015. The current usage metrics is available 48-96 hours after online publication and is updated daily on week days.
Initial download of the metrics may take a while.