Open Access
Fig. 9
Download original image
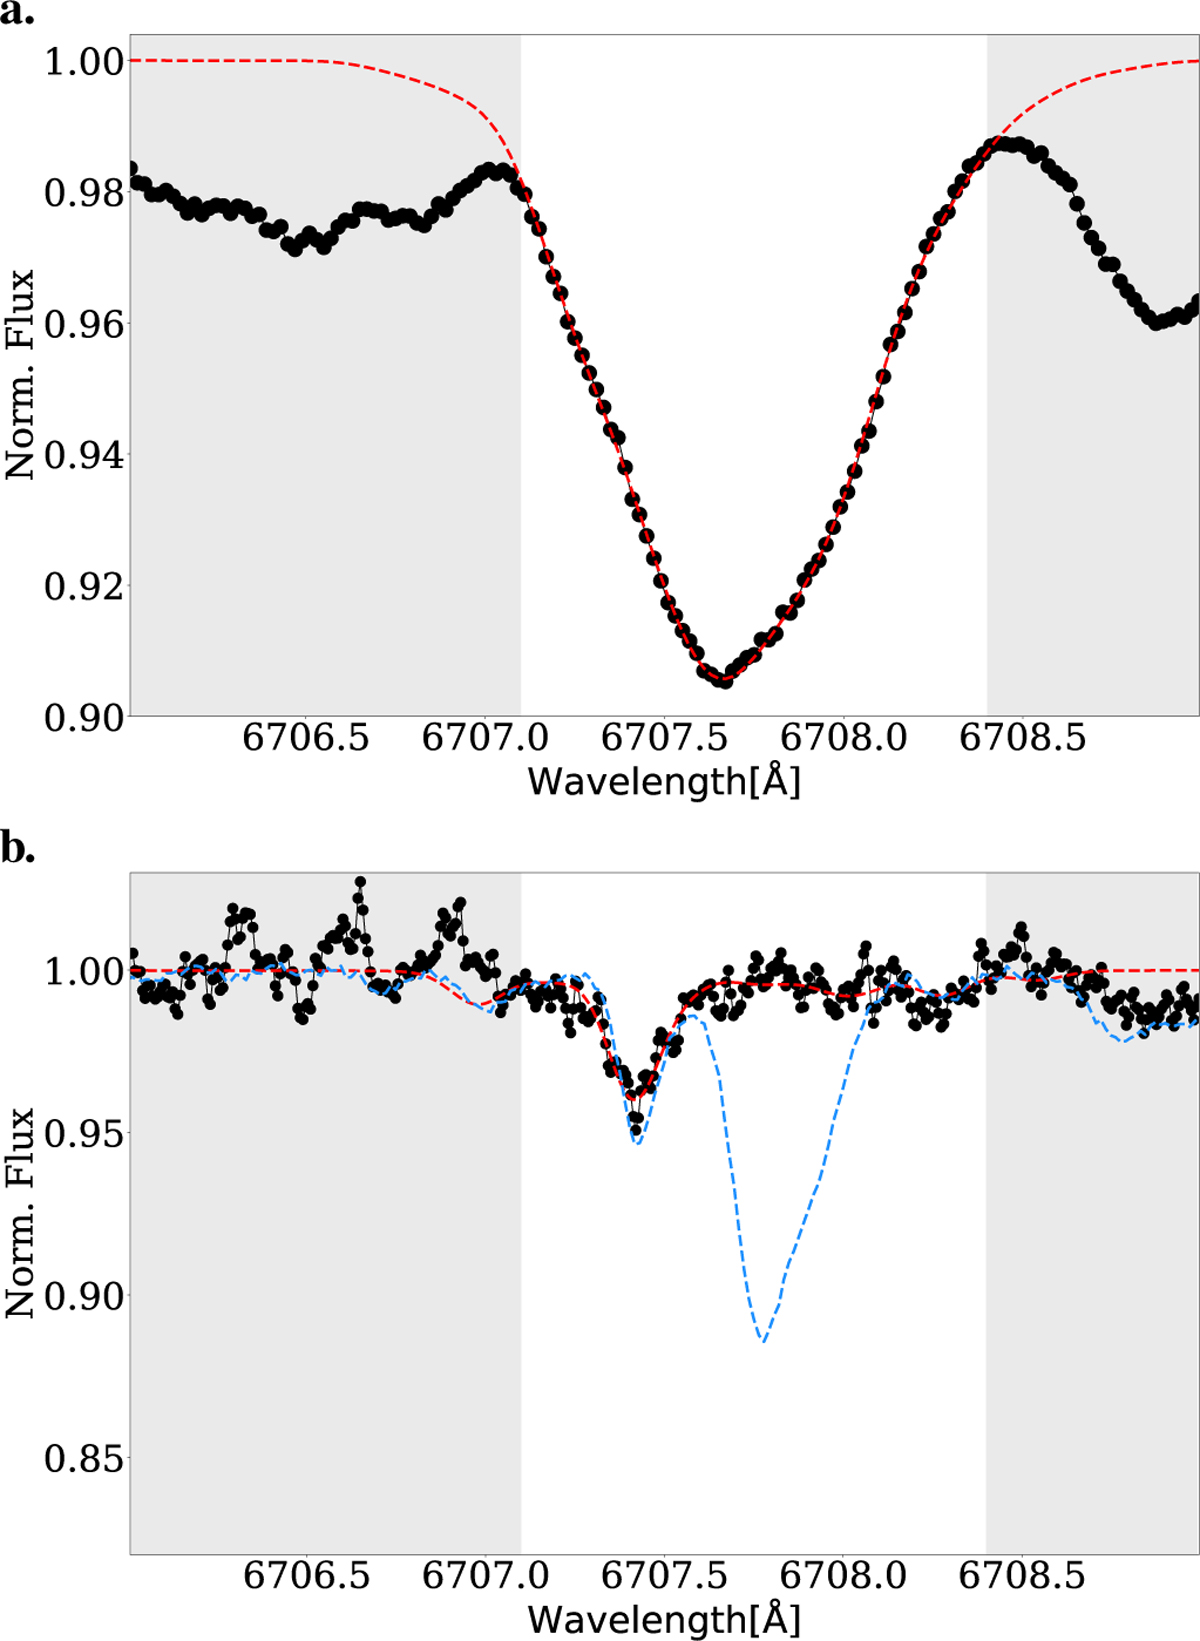
Lithium abundance analysis. Panel a: median spectrum of HR 7275a (black dots) and Turbospectrum fit (dashed red line). The gray shaded areas indicate the regions outside the fitting range (white). Panel b: same as panel a, but for HR 7275b. The dashed blue line shows a PEPSI spectrum of 70 Vir.
Current usage metrics show cumulative count of Article Views (full-text article views including HTML views, PDF and ePub downloads, according to the available data) and Abstracts Views on Vision4Press platform.
Data correspond to usage on the plateform after 2015. The current usage metrics is available 48-96 hours after online publication and is updated daily on week days.
Initial download of the metrics may take a while.