Open Access
Fig. 1.
Download original image
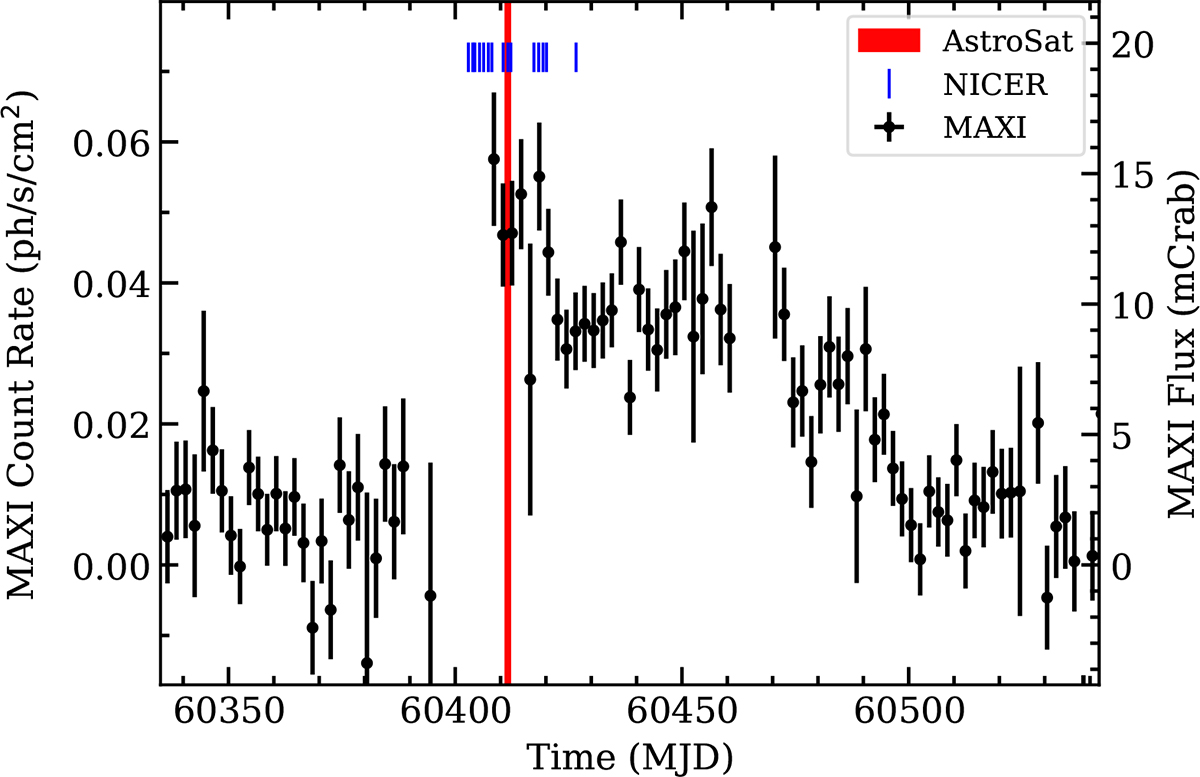
Light curve of RX J0520.5–6932 in the 2–20 keV energy band during its 2024 outburst from MAXI-GSC binned at two days. The MAXI data points represent the source intensity, whereas the vertical solid red line marks the epoch of AstroSat observation, and the blue tick markers indicate the epoch of NICER pointings.
Current usage metrics show cumulative count of Article Views (full-text article views including HTML views, PDF and ePub downloads, according to the available data) and Abstracts Views on Vision4Press platform.
Data correspond to usage on the plateform after 2015. The current usage metrics is available 48-96 hours after online publication and is updated daily on week days.
Initial download of the metrics may take a while.