| Issue |
A&A
Volume 706, February 2026
|
|
|---|---|---|
| Article Number | A322 | |
| Number of page(s) | 13 | |
| Section | Astrophysical processes | |
| DOI | https://doi.org/10.1051/0004-6361/202557736 | |
| Published online | 17 February 2026 | |
Probing accretion dynamics and spin evolution in the X-ray pulsar RX J0520.5–6932 during its 2024 outburst
1
Inter-University Centre for Astronomy and Astrophysics (IUCAA) Ganeshkhind Pune 411007, India
2
Raman Research Institute, C V Raman Avenue Sadashivanagar Bangalore 560080, India
3
Indian Institute of Science Education and Research (IISER) Mohali Punjab 140306, India
4
School of Physics & Astronomy, University of Southampton Southampton Hampshire SO17 1BJ, UK
5
Indian Institute of Astrophysics Koramangala II Block Bangalore 560034, India
6
Università degli Studi di Cagliari, Dipartimento di Fisica, SP Monserrato-Sestu KM 0.7 09042 Monserrato, Italy
7
Max-Planck-Institut für extraterrestrische Physik Gießenbachstraße 1 D-85748 Garching bei München, Germany
8
National Astronomical Observatories, Chinese Academy of Sciences 20A Datun Road Beijing 100101, China
9
School of Astronomy and Space Science, University of Chinese Academy of Sciences 19A Yuquan Road Beijing 100049, China
★ Corresponding author: This email address is being protected from spambots. You need JavaScript enabled to view it.
Received:
17
October
2025
Accepted:
16
November
2025
Abstract
Context. After nearly a decade of quiescence, the transient Be/X-ray binary pulsar RX J0520.5–6932 underwent an outburst in 2024. We performed X-ray monitoring of the source with NICER and AstroSat near the peak of the event.
Aims. Our primary objective was to investigate the energy and luminosity dependence of the pulsed emission, characterize the spin evolution, and study the broadband X-ray spectral properties of RX J0520.5–6932 during the outburst.
Methods. We extracted light curves and spectra from NICER and AstroSat observations carried out during the outburst. Pulsations were detected using epoch-folding techniques, enabling a detailed study of pulse-profile evolution as a function of energy and intensity. Broadband spectral modeling was performed using simultaneous data from SXT, LAXPC, and NICER. The spectra from individual NICER observations were used to study spectral variability.
Results. The AstroSat/LAXPC and NICER light curves reveal pronounced short-duration flaring activity lasting ∼400–700 s with enhancements in intensity by about a factor of two. The pulse profile exhibits a strong dependence on both energy and intensity, evolving from a simple single-peaked structure at low energies to complex multi-peaked shapes at intermediate energies and reverting to simpler morphologies at higher energies. Pulse profiles during the flares differ significantly from those in the persistent state, indicating changes in the pulsed beam pattern with a change in the intensity on a short timescale. Broadband spectral analysis revealed a soft excess and an emission feature at ∼1 keV likely arising from reprocessed emission in the accretion disk and fluorescence from Ne K and Fe L ions. Continuous NICER monitoring over nearly one orbital cycle enabled us to track spin evolution with accretion-driven spin-up and spectral variability in the soft X-ray band. Additionally, we observed a declining spin-up rate during the outburst, likely due to a gradual reduction in mass accretion rate.
Conclusions. Our results provide a comprehensive view of the complex accretion dynamics in RX J0520.5–6932 during its 2024 outburst. The strong variability in pulse shape and spin behavior highlights rapid changes in the accretion geometry and torque as a function of accretion rate.
Key words: accretion / accretion disks / stars: neutron / pulsars: individual: RX J0520.5–6932 / X-rays: binaries
© The Authors 2026
 Open Access article, published by EDP Sciences, under the terms of the Creative Commons Attribution License (https://creativecommons.org/licenses/by/4.0), which permits unrestricted use, distribution, and reproduction in any medium, provided the original work is properly cited.
This article is published in open access under the Subscribe to Open model. This email address is being protected from spambots. You need JavaScript enabled to view it. to support open access publication.
1. Introduction
Accretion-powered X-ray pulsars (XRPs) are magnetized neutron stars in binary systems, where accretion of matter from a companion star gives rise to pulsed X-ray emission. A majority of XRPs are found in high-mass X-ray binaries (HMXBs; Liu et al. 2006), which typically host either a Be-type star or an OB supergiant companion. Among these, systems composed of a Be star and a neutron star, often in an eccentric orbit, are classified as Be/X-ray binaries (BeXRBs; Reig 2011). These systems are often transient in nature and are primarily detected during outburst phases, either regular Type-I outbursts, which occur near periastron as the neutron star passes through the circumstellar disk of the Be star, or more energetic and less frequent Type-II outbursts, which are likely triggered by large-scale mass ejections from the Be star. The latter can occur at any orbital phase and are sometimes linked to warping or structural changes in the Be disk. Due to their strong variability and wide dynamic range, transient X-ray pulsars serve as valuable laboratories for studying accretion physics under different luminosity regimes.
RX J0520.5–6932 is a BeXRB system located in the Large Magellanic Cloud (LMC), initially discovered through observations by ROSAT (Schmidtke et al. 1994). A major outburst was recorded in 1995, with concurrent detection in optical and X-ray bands (Edge et al. 2004). During a giant outburst in 2014, the source’s X-ray luminosity reached values close to the Eddington limit for a neutron star (Vasilopoulos et al. 2014b). Coherent X-ray pulsations at a period of ∼8 s confirmed its nature as an accreting X-ray pulsar (Vasilopoulos et al. 2014a). Notably, Tendulkar et al. (2014) reported the detection of a cyclotron resonant scattering feature (CRSF) at ∼31–32 keV, corresponding to a surface magnetic field strength of the order of ∼1012 G.
After nearly a decade of quiescence, RX J0520.5–6932 re-entered an outburst phase in late March 2024, as reported by multiple observatories (Semena et al. 2024; Sharma et al. 2024a; Zhang et al. 2024). The event prompted extensive follow-up observations using multiple instruments such as AstroSat, Neutron star Interior Composition ExploreR (NICER), Neil Gehrels Swift Observatory (Swift), Nuclear Spectroscopic Telescope ARray (NuSTAR), the Einstein Probe (EP), and Lobster Eye Imager for Astronomy (LEIA) (e.g., Yang et al. 2025). While the orbital parameters of the system have been studied previously (Kuehnel et al. 2014; Karaferias et al. 2023), inconsistencies remain among reported values, particularly between those derived from X-ray and optical data (Vasilopoulos et al. 2014b). Notably, a degeneracy in the orbital period between 23.91 and 24.38 days has been reported based on combined spin frequency evolution during the 2014 and 2024 outbursts (Yang et al. 2025).
In this work, we present the results from a detailed timing and spectral study of RX J0520.5–6932 using a Target of Opportunity (ToO) observation with AstroSat and NICER observations obtained during the peak of its 2024 outburst. The broadband spectral properties were examined by combining data from the Soft X-ray Telescope (SXT) and Large Area X-ray Proportional Counter (LAXPC) on board AstroSat and simultaneous NICER observation. The structure of the paper is as follows: Section 2 presents the observations and data reduction procedures. Section 3 presents the results of the timing and spectral analysis. We discuss our findings in Section 4 and conclude in Section 5.
2. Observation and data analysis
Figure 1 presents the outburst light curve of RX J0520.5–6932 during the 2024 outburst with the Gas Slit Camera (GSC) on board the Monitor of All-sky X-ray Imager (MAXI; Matsuoka et al. 2009). The AstroSat observation was carried out on 2024 April 11 (MJD 60411), covering nearly one day, marked as the vertical red line in Fig. 1. Meanwhile, NICER monitored the source from 2024 April 2 to 26 (MJD 60402–60426), around the peak of the outburst, indicated by vertical blue tick marks. Observation details are provided in Table 1.
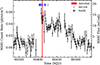 |
Fig. 1. Light curve of RX J0520.5–6932 in the 2–20 keV energy band during its 2024 outburst from MAXI-GSC binned at two days. The MAXI data points represent the source intensity, whereas the vertical solid red line marks the epoch of AstroSat observation, and the blue tick markers indicate the epoch of NICER pointings. |
2.1. AstroSat
AstroSat is India’s first dedicated multi-wavelength astronomy satellite (Agrawal 2006; Singh et al. 2014), launched in 2015. In this work, we analyze data from SXT and LAXPC.
2.1.1. LAXPC
LAXPC is one of the primary instruments aboard AstroSat. It consists of three co-aligned identical proportional counters (LAXPC10, LAXPC20, and LAXPC30) that work in the energy range of 3–80 keV. Each LAXPC detector independently records the arrival time of each photon with a time resolution of 10 μs and has five layers (for details see Yadav et al. 2016; Antia et al. 2017).
During our observation, LAXPC10 was operating at low gain, and LAXPC30 was offline. Therefore, we used data only from the LAXPC20 detector for our analysis. We utilized the event analysis (EA) mode data and processed it using the LAXPCSOFT1 version 3.4.4 software package to extract light curves. Background estimation was performed using blank sky observations as described in Antia et al. (2017), and appropriate response files were used for energy calibration. The source and background spectra were extracted using the faint source model following the method outlined in Misra et al. (2021).
We corrected the LAXPC photon arrival times to the Solar System barycenter using the AS1BARY2 tool with the JPL-DE405 ephemeris. We used the best available position of the source, RA (J2000) = 05h20m30.90s and Dec (J2000) = −69° 31′55.0″ (Bonanos et al. 2009).
2.1.2. SXT
SXT is a focusing X-ray telescope with CCD in the focal plane that can perform X-ray imaging and spectroscopy in the 0.3–7 keV energy range (Singh et al. 2016, 2017). RX J0520.5–6932 was observed in the photon counting (PC) mode with SXT. Level 1 data were processed with AS1SXTLevel2-1.4b pipeline software to generate level 2 cleaned event files. These cleaned files from individual orbits were merged using the SXT event merger tool3. The merged event file was then used to extract images, light curves, and spectra using the XSELECT task, provided as part of HEASOFT version 6.31.1. A circular region with a radius of 16 arcmin centred on the source was used. No source pile-up was observed as the count rate was below the threshold limit of pileup (< 40 counts s−1) in the PC mode4. For spectral analysis, we used the blank sky SXT spectrum as background (SkyBkg_sxt_LE0p35_R16p0_v05_Gd0to12.pha) and spectral redistribution matrix file (sxt_pc_mat_g0to12.rmf) provided by the SXT team5. We generated the correct off-axis auxiliary response files (ARF) using the sxtARFModule tool from the on-axis ARF (sxt_pc_excl00_v04_20190608.arf) provided by the SXT instrument team. The SXT spectrum was optimally rebinned using FTGROUPPHA to have a minimum of 25 counts per bin (Kaastra & Bleeker 2016). Owing to a low duty cycle (∼20%) and a time resolution of ∼2.3 s, we did not use SXT data for timing analysis in this work.
2.2. NICER
NICER (Gendreau et al. 2016) is a soft X-ray telescope that was installed on the International Space Station (ISS) in June 2017, and it is equipped with the X-ray timing instrument (XTI). The XTI consists of 56 co-aligned focal plane modules (FPMs), each made up of an X-ray concentrator optic associated with a silicon drift detector. The instrument provides a high temporal resolution of ∼100 ns, high spectral resolution of ∼85 eV at 1 keV, and a large effective area of ∼1900 cm2 at 1.5 keV, utilizing 52 active detectors. Each NICER observation typically comprises multiple short-duration pointings of the source called snapshots, primarily driven by ISS orbit and visibility constraints.
NICER monitored RX J0520.5–6932 from MJD 60402 to 60426 (Table 1). The data were processed using HEASOFT version 6.33.2 and the NICER data analysis software (nicerdas) version 2024-02-09_V012A with Calibration Database (CALDB) version xti20240206. Standard calibration and screening criteria such as cor_range = 1.5–*, max_lowmem = 250, and threshfilter=NIGHT were applied using nicerl2. We extracted spectral files and responses (ARF and RMF files) using nicerl3-spect. The background was obtained using the 3C50 model (Remillard et al. 2022). The energy band of NICER analysis was limited to 0.5–10 keV. Light curves were extracted using xselect. The event times were corrected to the Solar System barycenter using barycorr with the JPL-DE405 ephemeris.
Log of X-ray observations of RX J0520.5–6932 analyzed in this work.
3. Results
3.1. Timing analysis
Fig. 2 shows the AstroSat/LAXPC light curves of RX J0520.5–6932 in the 3–25 keV energy range, with the bottom panel displaying the hardness ratio, defined as the ratio of count rates in the 8–25 keV and 3–8 keV energy ranges. The light curve exhibits pronounced flaring activity within the first 40 ks of the observation. To systematically identify these flares, we analyzed each good time interval (GTI) using the find_peaks routine from the SCIPY package (Virtanen et al. 2020), applying a detection threshold of 75 counts s−1. We identified a total of seven flares, with durations ranging from 400 to 700 s, as highlighted by shaded regions in Fig. 2. During these events, the peak count rate increased by a factor of ∼1.5–2 relative to the persistent level. The bottom subplot highlights a representative segment of the light curve featuring one such flare, where the count rate increased by a factor of ∼2 during the peak of the flare compared to the pre- and post-flare count rates. Despite this variability in intensity, the hardness ratio remains largely constant throughout the AstroSat observation, suggesting little to no associated spectral variation during the flares.
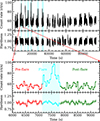 |
Fig. 2. AstroSat/LAXPC light curve of RX J0520.5–6932 during its 2024 outburst in the 3–25 keV energy range, binned at 50 seconds. The bottom subplot highlights a zoomed-in segment of the light curve (from the second orbit) showing short-timescale flaring events, where different colors (red, cyan, and green) mark pre-flare, flare, and post-flare intervals, respectively. The bottom panel of each subplot displays the hardness ratio, defined as the ratio of count rates in the 8–25 keV and 3–8 keV energy bands. The shaded region highlights the detected flaring events. |
We also examined the NICER light curves for similar flaring activity. While the short duration of individual snapshots (400–600 s) made systematic identification challenging, we found evidence of significant count rate enhancements in a few cases. For instance, in observation ID 7204300102 and two snapshots of 7204300103, the 0.5–10 keV count rate increased from ∼30–40 counts s−1 to over 90 counts s−1. Although the decay phase of these events was not captured due to GTI limitations, visual inspection indicates that the flares likely lasted more than 400 s.
To investigate the aperiodic and periodic timing behavior, we extracted a power density spectrum (PDS) from the 3–25 keV LAXPC light curve, binned at 0.5 s. The PDS was averaged over 17 segments of 4096 s each and then logarithmically rebinned with a factor of 1.02. The resulting PDS was Poisson noise subtracted and rms normalized, is shown in Fig. 3. The PDS shows prominent peaks at the fundamental spin frequency of the neutron star, ∼0.124 Hz (corresponding to a spin period of 8.03 s) and its harmonics superimposed on a continuum of red noise. The noise continuum can be best described by a combination of three Lorentzians (Belloni et al. 2002; Reig 2008; Sharma et al. 2024b), representing peaked noise around 1, 10, and 500 mHz, likely reflecting variability in the accretion environment on multiple timescales. Stochastic variability on timescales of around hundred seconds is also evident in the light curve itself (bottom panel of Fig. 2). The three Lorentzian components had rms of 11.8 ± 1.2%, 12 ± 1%, and 20.5 ± 0.5%, respectively.
 |
Fig. 3. Power density spectrum of RX J0520.5–6932 in the 3–25 keV band obtained from AstroSat/LAXPC data. The continuum was modeled using a combination of three Lorentzian components representing broad noise features at different characteristic frequencies. Sharp peaks due to the neutron star’s spin frequency and its harmonics were excluded from the fit. |
 |
Fig. 4. Spin frequency evolution of RX J0520.5–6932 during the 2024 outburst. Top: Barycenter-corrected spin frequencies from NICER, AstroSat, Fermi/GBM and NuSTAR, overlaid with the composite model ν(t) = νint(t)−νorb(t) (solid red line), which combines the intrinsic quadratic spin evolution with the fixed orbital parameters from Yang et al. (2025) (Solution II). Middle: Spin frequencies after correcting for orbital motion. A quadratic model (solid line) fits all data points and captures the evolving spin-up trend, while a linear model (dashed line) fits only the early part of the outburst (excluding the final NICER point). Bottom: Residuals of the quadratic and linear fits. The residuals clearly favor the quadratic model, supporting the presence of a varying spin-up rate during the outburst. |
 |
Fig. 5. Energy-resolved dynamic pulse profiles of RX J0520.5–6932 obtained from AstroSat/LAXPC data during the 2024 outburst. The color map represents the normalized pulse intensity across different energy bands. Strong energy dependence is evident, with the secondary peak most prominent in the 7–14 keV range and broadening of off-pulse appearing at higher energies. The energy-average pulse profile is overplotted as a dashed line. |
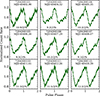 |
Fig. 6. Pulse profiles in the 0.5–10 keV energy range from individual NICER observations folded using the respective spin frequencies reported in Table A.1. The profiles are phase-aligned such that the main peak is centered around phase 1. The corresponding obsID, date (in MJD), and pulsed fraction (PFrms) are mentioned at the top and bottom of each panel, respectively. |
To determine the spin frequency of the neutron star, we first applied the epoch-folding technique using the efsearch task (Leahy 1987) on the barycenter-corrected photon arrival times from the NICER and AstroSat observations. For each NICER observation, the best spin frequency was determined, and uncertainties were estimated using the bootstrap method (Boldin et al. 2013), by simulating 1000 light curves following the method of Sharma et al. (2023b). For observations with at least three snapshots, we also confirmed the spin frequencies using a phase-connection approach. Coherent pulsations at ∼8 s were detected across all NICER observations, although some lower-exposure observations did not permit precise spin tracking. The resulting spin frequencies are listed in Table A.1.
For the AstroSat observation, an initial spin estimate was similarly refined using a phase-connection technique, which revealed a gradual phase drift in the pulse profile, indicative of a non-zero spin frequency derivative. This barycentric analysis yielded a spin frequency of ν0 = 0.12454877(15) Hz and a negative spin frequency derivative, suggesting an apparent spin-down. However, this result does not account for orbital motion and is therefore not physically meaningful.
The top panel of Fig. 4 shows the spin frequency evolution of RX J0520.5–6932, combining measurements from NICER, AstroSat, NuSTAR (see, Yang et al. 2025) and Fermi-GBM (Malacaria et al. 2020). The spin frequency exhibits a clear sinusoidal modulation, indicative of Doppler shifts due to orbital motion. To account for this, we used a composite expression that accounts for both the intrinsic spin evolution and orbital Doppler shifts:
 (1)
(1)
where, νorb(t) represents the frequency shift caused by the Doppler effect (Galloway et al. 2005), and νint(t) represents the intrinsic frequency of the source given by
 (2)
(2)
where ν0,  , and
, and  are the spin frequency, spin derivative, and second derivative, respectively, at the reference time T0.
We modeled νorb(t), using the orbital parameters from Yang et al. (2025). Since there exists a degeneracy in the orbital solutions proposed by Yang et al. (2025), primarily due to uncertainty in the exact number of orbital cycles that occurred between the two successive outbursts. We adopted their Solution-II, with an orbital period of 24.38 days, as it is closer to the reported optical period of 24.43 days (Vasilopoulos et al. 2014a). We did not attempt to fit the orbital parameters, as our data do not provide tighter constraints on the orbit than those already reported.
We then applied orbital correction using Solution II to the NICER, AstroSat, and NuSTAR data and repeated the timing analysis. For the AstroSat dataset, this yielded an updated spin frequency of ν0 = 0.12456285(15) Hz and a spin derivative of  Hz s−1, consistent with accretion-driven spin-up. The orbital-corrected spin frequencies are listed in Table A.1. The middle panel of Fig. 4 shows the orbital-corrected spin frequencies from NICER, AstroSat, and NuSTAR. Orbital-corrected spin frequencies from Fermi-GBM were excluded, as they were derived using a different orbital solution than the one adopted in this work. A clear increasing trend in spin frequencies is observed, supporting spin-up during the outburst (Yang et al. 2025).
The spin trend was modeled using both linear and quadratic forms of the intrinsic spin evolution (νint(t)). A linear fit ( ) to all points yielded a poor fit statistic (χ2/d.o.f. = 235/9), indicating that a constant spin-up rate cannot adequately describe the observed evolution. However, if the final NICER point at MJD 60418 is excluded, the linear model (dashed line) provides a reasonable fit with χ2/d.o.f. = 13.5/9. In contrast, a quadratic model (solid line) better captures the full evolution (χ2/d.o.f. = 5/8). The quadratic term revealed a measurable second derivative of the spin frequency,
  Hz s−2, indicating a changing spin-up rate during the outburst. The bottom panel of Fig. 4 shows residuals of the quadratic model with all observations and the linear model excluding the final point, clearly illustrating the improved fit provided by the second-order term. For comparison, the top panel also overplots the composite model ν(t) using the best-fit intrinsic spin parameters and the fixed orbital solution. The consistency between the composite model and the observed spin frequency evolution validates the orbital correction and confirms the presence of an evolving spin-up torque during the outburst. Table 2 summarizes the spin parameters inferred from the orbital-corrected timing analysis. The spin parameters inferred from the broadband AstroSat observation are in agreement with the long-term trend seen across the outburst.
Spin ephemeris parameters derived from the AstroSat/LAXPC observation along with the evolution of the spin frequency during the 2024 outburst based on the measurements from NICER, AstroSat, and NuSTAR observations.
We also tested Solution-I from Yang et al. (2025), with an orbital period of 23.92 days. The spin frequencies obtained from individual observations and the overall spin evolution were found to be broadly consistent within uncertainties, with those derived using Solution-II.
 |
Fig. 7. Energy-resolved pulse profile from NICER observations. The corresponding obsID and date (in MJD) are mentioned on top of each figure. The corresponding pulsed fraction (PFrms) in each selected energy range is mentioned in each subpanel. |
3.1.1. Pulse profiles
We created the pulse profile of RX J0520.5–6932 using orbital-corrected AstroSat/LAXPC data folded with the respective spin frequency and derivative listed in Table 2. The energy-average pulse profile is shown in Fig. 5 with a dashed line. The profile is clearly asymmetric, exhibiting a secondary minor peak ∼0.2 in phase before the main peak, and a left-side wing preceding the minor peak. To examine the energy dependence of the pulse morphology, we extracted background-corrected light curves in multiple energy bands from the AstroSat/LAXPC observation. Fig. 5 shows a color map illustrating the evolution of pulse profile shape across energy. No significant pulsed signal was detected above 29 keV, likely due to background dominance and limited photon statistics. The secondary peak is most pronounced in the intermediate energy range (∼7–14 keV). At low energies (3–4 keV), the source showed a single-peaked asymmetric pulse profile. At higher energies (17–20 keV), the wing emission before the minor peak diminishes, giving way to a broadening of the off-pulse region, and a noticeable excess appears near phase 0.4–0.5, creating twin dips on either side of this excess. The profile above 23 keV shows a deeper dip around phase 0.6, indicating significant evolution of the emission geometry with energy. For clarity, we also present the pulse profiles in the selected energy range of 3–4, 4–7, 7–14, 14–20, 20–23, and 23–29 keV in Fig. A.1.
Fig. 6 shows the pulse profiles from individual, orbital-corrected NICER observations in the 0.5–10 keV energy range, corresponding to epochs where spin frequency measurements were performed. Each profile was folded using the respective spin frequency listed in Table A.1. The resulting profiles are predominantly single-peaked and asymmetric, with minor substructures that evolve with time. Next, we generated energy-resolved profiles from the NICER observations with exposures exceeding 1 ks. Fig. 7 shows the resulting profiles in the energy range of 0.5–1, 1–3, 3–5, and 5–10 keV. These profiles also showed clear energy dependence with evolving minor structures.
 |
Fig. 8. Energy dependence of the rms pulsed fraction, derived from simultaneous AstroSat/LAXPC and NICER observations. The pulsed fraction shows a clear increasing trend with energy. |
To quantify the pulse modulation, we calculated the root-mean-square (rms) pulsed fraction, PFrms, following the definition from Wilson-Hodge et al. (2018):
![Mathematical equation: $$ \begin{aligned} PF_{\rm rms} = \frac{1}{\bar{p} \sqrt{N}} \left[\sum \limits _{i = 1}^N (p_{i} -\bar{p})^2\right]^\frac{1}{2}, \end{aligned} $$](/articles/aa/full_html/2026/02/aa57736-25/aa57736-25-eq10.gif) (3)
(3)
where N is the number of phase bins,  is the mean count rate, and pi is the count rate in the i-th phase bin. The PFrms values computed from individual pulse profiles from NICER are mentioned in each subpanel of Fig. 6 and 7, with the corresponding observation dates noted at the top. The PFrms varied between ∼9–12% in the 0.5–10 keV energy range. The energy-resolved profiles showed a large dynamic variation of pulsed fraction, with an increasing trend with energy. The PFrms ranged from ∼4–6% in the 0.5–1 keV, ∼10–13% in 1–3 keV, ∼12–15% in 3–5 keV, and ∼10–20% in 5–10 keV.
For the AstroSat/LAXPC data, the PFrms was found to be ∼22% in the 3–25 keV energy range. To further examine the energy dependence of pulse modulation, we computed PFrms across multiple energy bands using simultaneous AstroSat and NICER observations. The resulting PFrms as a function of energy is shown in Fig. 8, revealing a clear increasing trend with energy, consistent with findings from other studies (Lutovinov & Tsygankov 2009; Ferrigno et al. 2023; Sharma et al. 2024b; Yang et al. 2025).
Flaring episodes observed during the AstroSat observation prompted an investigation into the intensity dependence of the pulse profiles. We selected one of the segments with flare and extracted light curves for the pre-flare, flare, and post-flare intervals as identified in the inset panel of Fig. 2. The corresponding pulse profiles are shown in the right panel of Fig. 9. At lower or persistent intensities (pre- and post-flare), the secondary peak near phase ∼0.8 is clearly visible, but it vanishes entirely during the flaring phase. Next, we generated different intensity-filtered light curves using data from the entire observation, and the left panel displays the dynamic intensity-resolved color map of the pulsed emission, highlighting that the secondary peak does not merge with the first peak but rather disappears during the flares. At low intensities (≲65 counts s−1), the secondary peak is well defined, but it diminishes at higher intensities and is absent during bright flaring phases. This behavior suggests changes in the emission geometry during flaring intervals, potentially driven by variable accretion from clumpy or inhomogeneous flows. The PFrms also varies with intensity: decreasing from 24.4% to 20.7% between the low and intermediate count-rate regimes (40 to 65 counts s−1), and then rising to 23.8% for > 85 counts s−1, indicating non-monotonic modulation likely tied to accretion dynamics.
 |
Fig. 9. Intensity-resolved and flare-resolved pulse profiles of RX J0520.5–6932 from AstroSat/LAXPC during the 2024 outburst. Left: Dynamic pulse profiles across different intensity intervals. The color map shows normalized pulse shapes, revealing notable structural changes in pulse morphology. The intensity-average pulse profile is overplotted as a dashed line for comparison. Right: Pulse profiles extracted for three distinct flux states identified in Fig. 2: pre-flare, flare, and post-flare intervals. The secondary peak is clearly visible before and after the flare but disappears during the flare, suggesting a change in the emission geometry. |
3.2. Spectral analysis
We performed spectral fitting using XSPEC version 12.14.1 (Arnaud 1996). A distance of 50 kpc was assumed for the source, consistent with its location in the LMC (Pietrzyński et al. 2013). Given the low metallicity environment of the LMC, the photo-electric absorption was modeled as a combination of Galactic foreground absorption and an additional column density accounting for both the interstellar medium of the LMC and the absorption local to the source. The Galactic absorption was fixed at  cm−2 (Dickey & Lockman 1990), with elemental abundances set according to Wilms et al. (2000). The intrinsic LMC absorption,
  , was treated as a free parameter in the fit, with sub-solar abundances (0.49 for elements heavier than helium) adopted based on Rolleston et al. (2002), following Vasilopoulos et al. (2014a, 2016). Unless otherwise specified, all uncertainties and upper limits on the spectral parameters are quoted at the 90% confidence level for one parameter of interest.
3.2.1. NICER+AstroSat
The NICER observation (OBS ID: 7204300110) is contemporaneous with AstroSat. To study the broadband spectrum of RX J0520.5–6932, we performed a combined spectral analysis of NICER, SXT, and LAXPC20 data. We consider the LAXPC20 data up to 50 keV for the spectral fitting. The SXT data in the energy range of 1–7 keV are used for the combined spectral fitting. We added a constant component representing the cross-calibration between the NICER, SXT, and LAXPC20 instruments. We also applied a gain correction for the SXT. The gain slope was fixed to 1.0, and the offset was allowed to vary. The gain offset was found to be −32 eV. A systematic uncertainty of 2% was used during spectral fitting.
The hard X-ray continuum spectrum of X-ray pulsars can be fitted by a phenomenological power law-like shape with an exponential high-energy cutoff that originates from the accretion column (e.g., Coburn et al. 2002; Maitra et al. 2018). We modeled the combined broadband spectra of RX J0520.5–6932 in the energy range of 0.5–50 keV using an absorbed powerlaw with a high-energy cutoff model. This model alone provided a statistically unacceptable fit (χ2/d.o.f. = 545/231), with significant residuals seen below 1 keV (soft excess) and around 30 keV (absorption-like dip). Soft excesses are commonly observed in the spectra of X-ray pulsars and may arise from several physical mechanisms, including reprocessed emission from the inner accretion disk, hot plasma near the magnetosphere, or the neutron star surface, and may also be shaped by partial covering absorption (Hickox et al. 2004). Additionally, a CRSF at ∼32 keV has been previously reported in this source (Tendulkar et al. 2014; Yang et al. 2025). We therefore extended the model to include a thermal blackbody component (bbodyrad) for the soft excess and a multiplicative CRSF component (cyclabs; Makishima et al. 1990; Mihara et al. 1990) to model the absorption dip. This improved the fit significantly (χ2/d.o.f. = 286/226).
Nonetheless, residuals near ∼1 keV suggested the presence of an emission line (see Fig. 10c). Introducing a Gaussian emission line component at this energy further improved the fit (χ2/d.o.f. = 239/224). When left free, the line width was found to be relatively broad (∼0.17 keV), which strongly influenced the soft excess parameters, particularly lowering the blackbody temperature to 0.07 keV and increasing its normalization. To mitigate this degeneracy and obtain physically meaningful parameters, we fixed the Gaussian line width at the NICER spectral resolution of 85 eV. The observed broadening may be due to a blend of unresolved emission lines around ∼1 keV, such as those from Ne IX/X or Fe L-shell transitions. Fixing the line width avoids degeneracies with the soft excess continuum, yields a stable blackbody component with temperature ∼0.09 keV, and effectively models the residual structure without overestimating the soft flux. We also explored an alternative interpretation of the soft excess using a partial covering absorption model instead of the blackbody component. However, this resulted in a significantly poorer fit (χ2/d.o.f. = 274/224), disfavoring this scenario.
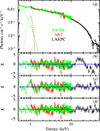 |
Fig. 10. Broadband X-ray spectrum of RX J0520.5–6932 from NICER, SXT, and LAXPC with residuals illustrating the contributions of key spectral components. (a): Unfolded spectrum fit with the model tbabs*tbvarabs*(bbodyrad + Gaussian + highecut*powerlaw*cyclabs). (b) Residuals (χ = (data-model)/error) after fitting without the cyclabs model. (c) Residuals after fitting without the 1 keV Gaussian emission line. (d) Residuals from the final best-fit model. |
We evaluated the statistical significance of the additional components: the blackbody, Gaussian line, and CRSF, using the simftest routine in XSPEC, based on 10 000 Monte Carlo simulations. In all three cases, the false alarm probability was found to be < 10−4, confirming their significance at greater than 3σ confidence. Furthermore, we found no strong evidence of an Fe Kα line in the spectrum, and derived an upper limit of 121 eV on its equivalent width, assuming a fixed line energy of 6.5 keV and a line width of 0.27 keV (Yang et al. 2025).
The best-fit spectral parameters are listed in Table 3, and the best-fit spectrum along with model components and residuals is shown in Fig. 10. We obtained an unabsorbed flux of ∼7 × 10⁻¹⁰ erg cm−2 s−1 in the 0.5–50 keV range. Extrapolating the model over the 0.1–100 keV band, the flux was estimated to be 7.5 × 10⁻¹⁰ erg cm−2 s−1, corresponding to an X-ray luminosity of 2.24 × 1038 erg s−1 for a source distance of 50 kpc (Pietrzyński et al. 2013).
Best-fit spectral parameters of RX J0520.5–6932 using the model tbabs*tbvarabs*(blackbody + Gaussian + highecut*powerlaw*cyclabs).
We also tested alternative continuum models such as cutoffpl, fdcut*powerlaw, or NPEX, but these provided poorer fits than the powerlaw*highecut model adopted here. Phase-resolved spectroscopy was not performed due to limited photon statistics.
3.2.2. Individual NICER spectrum
The continuum of individual NICER spectra obtained during the outburst is well described by a model consisting of an absorbed powerlaw, a soft thermal blackbody component, and a narrow Gaussian emission line at ∼1 keV. We also attempted to fit the spectra with a powerlaw with a cutoff, but no cutoff is required within the NICER energy band, except for 7204300115, where a cutoff was observed around 7 keV.
Fig. 11 presents the temporal evolution of the best-fit spectral parameters across all NICER observations. The LMC column density ( ) remained stable, with a mean value of ∼1.8 × 1021 cm−2. The photon index exhibited modest stochastic variations, with a mean value of Γ ∼ 0.71 and a range of 0.63 to 0.78, consistent with values reported by Swift-XRT, EP, and LEIA observations (Yang et al. 2025). After MJD 60417, the photon index showed a decreasing trend, indicating spectral hardening. However, comparable low values were also present during the initial phase of the outburst, likely reflecting stochastic fluctuations rather than a sustained trend. The normalization of the power-law component steadily decreased over time. Other spectral parameters did not display significant systematic trends. The unabsorbed flux varied by approximately ±25% over the monitoring period. The soft thermal excess was persistently detected at a temperature of 0.08–0.11 keV, with an inferred emission radius of the order of 103 km, consistent with emission from the inner accretion disk. Additionally, a broad emission line at ∼1 keV was detected in most NICER spectra, with equivalent widths ranging from ∼40 to 80 eV.
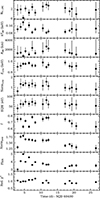 |
Fig. 11. Temporal variation of the best-fit spectral parameters of RX J0520.5–6932 from individual NICER observations during the 2024 outburst. The panels show (from top to bottom) the LMC Column density ( |

4. Discussion
In this work, we presented a comprehensive temporal and spectral study of the Be/X-ray binary pulsar RX J0520.5–6932 using data from AstroSat and contemporaneous monitoring with NICER during its 2024 outburst. We also used NICER observations to track the evolution of the neutron star’s spin and spectral properties over the course of the outburst.
4.1. Pulse properties and energy dependence
We detected strong pulsations at a spin frequency of ∼124 mHz in both AstroSat and individual NICER observations. The pulse profiles exhibited strong dependence on both energy and source intensity. The average profile from AstroSat/LAXPC also showed an asymmetric, single-peaked structure, with a distinct minor peak around phase 0.2 preceding the main peak.
The energy-resolved pulse shapes provide insights into the geometry of the X-ray emitting regions and the evolution of the radiation beam pattern with energy and accretion dynamics. The energy-resolved profiles from AstroSat/LAXPC showed strong energy dependence. At low energies (3–4 keV), the profile is asymmetric and lacks a secondary peak. In the intermediate band (∼7–14 keV), the profile became more complex, exhibiting a prominent secondary peak. At higher energies, the profile became single-peaked with broader off-pulse emission and a minor excess around phase 0.5 in the 17–20 keV band. Above 23 keV, the profile exhibited a deeper dip near phase 0.6 and lacked the excess at phase 0.5. The overall pulse morphology and its energy dependence during the AstroSat observation are consistent with recent NuSTAR findings (Yang et al. 2025). In particular, NuSTAR observations revealed a phase drift of the main peak by ∼0.15 from lower energies up to ∼30 keV, along with a gradual filling of the main trough at higher energies. A similar phase drift of ∼0.06 was observed in the AstroSat/LAXPC data from low energies up to ∼25 keV, and a deeper dip appeared above 23 keV.
The profile from individual NICER observations was asymmetric, single-peaked, with minor structures that evolved with both time and energy. The energy-resolved NICER profiles exhibited notable variability in the 0.5–1 keV band, where reprocessed emission and contributions from Ne IX/Ne X and Fe L lines are expected to dominate. This variability could arise from azimuthally asymmetric reprocessing of the pulsed emission or from emission line blends produced in the irradiated inner disk. However, given the moderate spectral resolution of the data, it is not possible to unambiguously distinguish between a reprocessed continuum component and blended line emission.
Such energy-dependent evolution of pulse profiles is commonly observed in X-ray pulsars. Typically, profiles are more complex at lower energies and become simpler, single or double-peaked at higher energies, as seen in sources like Vela X–1, 4U 1626–67, and LMC X–4 (Maitra & Paul 2013; Beri et al. 2014; Alonso-Hernández et al. 2022; Sharma et al. 2023a,b, 2025). At the lowest energies, where thermal reprocessed emission dominates (around ∼1 keV), the profiles can revert to a simpler single-peaked form, for example, in LMC X–4 (Beri & Paul 2017). In contrast, RX J0520.5–6932 exhibits a single asymmetric profile at low energies (above the thermal component), but shows complex multiple peaks at intermediate and higher energies, indicating a non-trivial beam pattern and possible contributions from different emission regions.
4.2. Flares and pulse profile change
Another prominent feature in the light curves of RX J0520.5–6932 is the presence of pronounced aperiodic variability and flares, with a time-scale of hundreds of seconds. Flares are on average brighter than the persistent emission by a factor of ∼2. Similar flaring behavior has been observed in other accreting pulsars, including Vela X–1 (Maitra & Paul 2013), GRO J1744–28 (Cannizzo 1997; Woods et al. 2000), SMC X–1 (Moon et al. 2003), Swift J1626.6–5156 (Reig et al. 2008), LMC X–4 (Moon & Eikenberry 2001; Beri & Paul 2017; Shtykovsky et al. 2018), A0538–66 (Ducci et al. 2019), EXO 2030+375 (Apparao 1991; Klochkov et al. 2011), 4U 1907+09 (Doroshenko et al. 2012), and 4U 1901+03 (James et al. 2011; Ji et al. 2020). These flares are generally attributed to instabilities in the accretion flow, such as Rayleigh–Taylor or magnetospheric instabilities, or to inhomogeneous (clumpy) stellar winds from the high-mass companion (Taam et al. 1988; Apparao 1991; Cannizzo 1997; Woods et al. 2000; Postnov et al. 2008). The brief flares observed in our data are consistent with the predictions of Romanova et al. (2008) and Kulkarni & Romanova (2008), in which Rayleigh–Taylor interchange instabilities at the disk-magnetosphere boundary lead to the formation of penetrating tongues. These unstable streams produce transient, stochastic hotspots on the neutron star surface, producing the observed flaring and pulse variability. Despite strong flux variability during the flares, we found no significant change in the hardness ratio, suggesting that the spectral shape remains largely unaltered, similar to what has been observed in 4U 1901+03 (James et al. 2011; Ji et al. 2020).
We also investigated the dependence of the pulse profile morphology on source intensity. At lower count rates (persistent or non-flaring, ≲65 counts s−1), a secondary peak is clearly visible, but it disappears entirely during brighter flaring phases. This behavior can be interpreted as direct evidence for short-timescale changes in the beaming pattern, likely driven by variations in the accretion rate (Ji et al. 2020). Similar to energy-resolved profiles, a phase drift of ∼0.07 was observed between the pulse profiles corresponding to intensities below 65 ct s−1 and above 80 ct s−1. The pulsed fraction also varied non-monotonically with intensity, supporting the view that the pulsed emission is shaped by the luminosity-dependent beam pattern and accretion column geometry. Changes in the mass accretion rate alter the accretion structures and radiation transfer close to the polar cap, which reshape the radiation beam pattern and, consequently, the observed pulse profile is strongly influenced by luminosity (Basko & Sunyaev 1976; Becker et al. 2012; Mushtukov et al. 2015).
4.3. Aperiodic variability
X-ray pulsars demonstrate stochastic variabilities in their X-ray flux on different timescales, which manifest as red noise, quasi-periodic variation, and coherent pulsations in PDS (Reig 2008). It is believed that a significant fraction of the variability is formed in the accretion disk as a result of fluctuations of the local viscosity (e.g., Lyubarskii 1997). The PDS of RX J0520.5–6932 also revealed red noise variability at multiple timescales, in addition to the prominent spin and harmonic peaks. The red noise was modeled using three Lorentzian components peaking at ∼1, 10, and 500 mHz, with fractional rms amplitudes of 11.8%, 12%, and 20.5%, respectively. These components likely correspond to variations in the accretion flow at different spatial scales within the disk. The ∼500 mHz component may correspond to the Keplerian frequency at the inner edge of the accretion disk (Revnivtsev et al. 2009), while the low-frequency variability (1–10 mHz) could be caused by stochastic accretion due to disk inhomogeneities or clumps causing flares.
4.4. Spin evolution
The spin evolution during giant outbursts offers valuable insight into accretion processes in BeXRBs. Accurate timing of pulsations across the orbit enables precise determination of orbital parameters through Doppler-induced modulations. As the neutron star accretes matter, the resulting torque can cause significant spin-up or spin-down, further modulated by orbital Doppler shifts. During the 2024 outburst, the barycenter-corrected spin frequencies of RX J0520.5–6932 exhibited a nearly sinusoidal modulation due to orbital motion, superimposed with an intrinsic spin-up trend driven by accretion. After applying orbital corrections using the known binary parameters, the spin frequencies showed a steady increase over time, as consistently observed in both AstroSat, NuSTAR, and NICER data. This behavior is analogous to the 2014 outburst, which also exhibited a sustained spin-up phase due to accretion (Karaferias et al. 2023; Yang et al. 2025).
Our long AstroSat observation, spanning over a day, enabled us to determine the intrinsic spin evolution using a phase-connection method. We measured a clear spin-up trend with a spin frequency derivative of  Hz s−1, consistent with spin-frequency evolution tracked across the outburst. Furthermore, we detected a second derivative of spin frequency,
  Hz s−2, indicating a gradual decline in the spin-up rate as the outburst progressed. This negative
  implies a weakening accretion torque over time, likely driven by a decrease in the mass accretion rate as the outburst decayed. A similar evolving spin-up rate has also been reported in other transient X-ray pulsars, for example, in 4U 1901+03 (Galloway et al. 2005).
The Ghosh & Lamb (1979) (GL) model is applicable to BeXB pulsars that accrete via a disk, especially in a strong accreting regime (Bozzo et al. 2009). This model predicts the spin-up rate ( ) in Hz s−1:
 (4)
(4)
where μ30 is magnetic moment in units of 1030 G cm3, I45 is moment inertia in 1045 g cm2, M1.4 = MNS/1.4 M⊙, RNS is the neutron star radius in cm, L37 = LX/1037 erg s−1 is the X-ray luminosity, and n(ωs) is the dimensionless accretion torque, which depends on the fastness parameter ωs, given by equations (10) and (16) of Ghosh & Lamb (1979). The magnetic moment is related to the surface dipole magnetic field B at poles through  . Assuming a canonical neutron star (MNS = 1.4 M⊙, RNS = 106 cm), B = 3.6 × 10¹² G (corrected for gravitational redshift; Yang et al. 2025) and a luminosity of 2.24 × 1038 erg s−1, we obtained
  Hz s−1 using the GL model, consistent with our measurement with timing analysis. Notably, the spin frequency derivative measured during the 2014 outburst was also in good agreement with the GL model (Sugizaki et al. 2017; Karaferias et al. 2023).
4.5. Spectral properties
RX J0520.5–6932 is observed to be accreting at an X-ray luminosity of 2.24 × 1038 erg s−1, close to the Eddington limit. The broadband X-ray spectrum is well described by a powerlaw continuum with a high-energy cutoff dominating above ∼1 keV. At lower energies, we detect a soft excess emission component with a blackbody temperature of ∼0.09 keV. A similar soft excess at ∼0.1–0.3 keV has been observed in other X-ray pulsars such as SMC X-1 (Paul et al. 2002), LMC X-4 (Paul et al. 2002; Naik & Paul 2004; Sharma et al. 2023b), Her X-1 (dal Fiume et al. 1998), 4U 1626-67 (Beri et al. 2015), and in extra-galactic ultraluminous X-ray pulsars (Kumar et al. 2025). This thermal excess is likely to originate from reprocessed hard X-rays illuminating the inner accretion disk, which is truncated by the magnetosphere of the neutron star (Paul et al. 2002; Hickox et al. 2004). From the normalization of the blackbody component and assuming a spherical emission geometry, the radius of the emission region is estimated to be  km, for a distance of 50 kpc.
The truncation radius of the disk is expected to coincide with the magnetospheric (or Alfvén) radius, where the magnetic pressure balances the ram pressure of accreting material (Pringle & Rees 1972; Ghosh & Lamb 1979):
 (5)
(5)
where k is the dimensionless coupling constant between 0.5–1 (Mushtukov & Tsygankov 2022), and Ṁ is the mass accretion rate inferred from the observed X-ray luminosity by LX = η Ṁc2 where η ≈ 0.2 is the accretion efficiency. Assuming a canonical neutron star, we estimate RM ∼ 1100–2100 km. This is in good agreement with the blackbody emission radius inferred from the spectral fit, further supporting a reprocessing origin for the soft excess.
In addition, we detect a broad emission feature at ∼0.97 keV with an equivalent width of ∼67 eV, likely originating from highly ionized Ne K or a blend of Fe L-shell transitions. Both the soft excess and this 1 keV line are consistently present in individual NICER spectra. However, these features were not apparent in the LEIA and Swift-XRT spectra, possibly due to limited statistics (Yang et al. 2025). No statistically significant Fe Kα emission was detected in our AstroSat+NICER spectra, with an upper limit on the equivalent width of 121 eV. However, a subsequent NuSTAR observation conducted 1 day later revealed the presence of an Fe Kα line with an equivalent width of ∼46 eV (Yang et al. 2025). The upper limit derived from AstroSat+NICER is not in conflict with the low equivalent width observed with NuSTAR.
We also confirm the presence of a CRSF at  keV, consistent with previous reports from NuSTAR (Tendulkar et al. 2014; Yang et al. 2025). The measured width and the optical depth of the CRSF are also found to be consistent with the NuSTAR measurements (Yang et al. 2025). The photon indices obtained from the joint AstroSat and NICER fit, as well as from individual NICER spectra, are consistent with those reported by Yang et al. (2025).
5. Conclusions
We have presented, for the first time, a detailed timing and broadband spectral investigation of the Be/X-ray binary pulsar RX J0520.5–6932 during its 2024 outburst, based on coordinated observations with NICER and AstroSat. Our results reveal several new aspects of the source’s accretion dynamics and emission behavior:
-
Flaring activity: The source exhibited remarkable variability, including frequent short flaring episodes with durations of a few hundred seconds and flux enhancements by a factor of ∼2. Such flaring behavior has not been reported previously from this source.
-
Energy-dependent pulse profile: The pulse morphology showed a strong dependence on both photon energy and source intensity. The pulse shape evolves from simple single-peaked shapes at low energies to complex multi-peaked structures at intermediate energies and reverting to simpler morphologies at higher energies.
-
Flares and emission geometry: Pronounced differences between flare and persistent pulse profiles indicate rapid changes in the emission geometry on short timescales. In particular, the disappearance of the secondary pulse peak and the increase in pulsed fraction during flares provide new evidence for transient accretion behavior in RX J0520.5–6932. These flare-induced changes likely reflect magnetospheric instabilities or inhomogeneous mass inflow phenomena that have not been observed previously in this source.
-
Soft excess and 1 keV line emission: Broadband spectral analysis revealed a soft thermal excess at ∼0.1 keV and a prominent emission feature near 1 keV, most likely originating from reprocessed emission in the inner accretion disk and contributions from Ne K and Fe L fluorescence, respectively. These spectral features were not reported in the previous study by Yang et al. (2025). We report the detection of the Ne K and Fe line complex for the first time in this source, enabled by the high sensitivity of the NICER data.
-
Spin evolution and accretion torque: Phase-connected timing analysis over the AstroSat observation revealed a clear accretion-driven spin-up, with a measured frequency derivative of
 Hz s−1. In addition, we also detected evidence for a decreasing spin-up rate as the outburst progressed, likely reflecting a gradual reduction in the mass accretion rate and corresponding accretion torque.
Overall, our findings demonstrate that RX J0520.5–6932 exhibits complex and rapidly evolving accretion dynamics during outburst, with both the pulsar’s spin and emission geometry responding sensitively to changes in the mass accretion rate. The combination of AstroSat and NICER data provided complementary strengths. AstroSat offered broadband spectral coverage, while NICER delivered high-cadence temporal sampling near the outburst peak and an independent timing baseline, consistency with those of Yang et al. (2025) reinforces the reliability of our results. Moreover, the clear decline in  with decreasing flux provides direct observational evidence of torque–accretion rate coupling, offering new constraints on magnetospheric accretion processes and valuable insights into the coupling between accretion dynamics, pulse emission, and spin evolution in BeXRBs.
BeXRBs in the Magellanic Clouds offer unique advantages for such studies, as they lie at well-determined distances and are relatively unobscured by interstellar dust, unlike most Galactic BeXRBs, which often suffer from distance uncertainties and high extinction. RX J0520.5–6932, located in the LMC, has a well-constrained distance of 50 kpc with a smaller relative distance uncertainty of 2.2% (Pietrzyński et al. 2013). This minimizes uncertainty in the luminosity estimate and makes RX J0520.5–6932 an ideal laboratory to study spin evolution, accretion torque, and emission properties of accreting pulsars, especially near-Eddington accretion rates.
Acknowledgments
Data from the ToO phase of AstroSat observation were used in this study, obtained from the Indian Space Science Data Centre (ISSDC), and NICER data obtained from the High Energy Astrophysics Science Archive Research Center (HEASARC). We thank the LAXPC Payload Operation Center (POC) and the SXT POC at TIFR, Mumbai, for providing the necessary software tools. We thank the NICER SOC Team for making the ToO observations possible. RS would like to thank Georgios Vasilopoulos for checking the consistency of the spin evolution obtained with NICER. AB acknowledges the financial support from SERB (SB/SRS/2022-23/124/PS) and is grateful to the Royal Society, United Kingdom.
References
- Agrawal, P. C. 2006, Adv. Space Res., 38, 2989 [Google Scholar]
- Alonso-Hernández, J., Fürst, F., Kretschmar, P., Caballero, I., & Joyce, A. M. 2022, A&A, 662, A62 [NASA ADS] [CrossRef] [EDP Sciences] [Google Scholar]
- Antia, H. M., Yadav, J. S., Agrawal, P. C., et al. 2017, ApJS, 231, 10 [NASA ADS] [CrossRef] [Google Scholar]
- Apparao, K. M. V. 1991, ApJ, 375, 701 [Google Scholar]
- Arnaud, K. A. 1996, ASP Conf. Ser., 101, 17 [Google Scholar]
- Basko, M. M., & Sunyaev, R. A. 1976, MNRAS, 175, 395 [Google Scholar]
- Becker, P. A., Klochkov, D., Schönherr, G., et al. 2012, A&A, 544, A123 [NASA ADS] [CrossRef] [EDP Sciences] [Google Scholar]
- Belloni, T., Psaltis, D., & van der Klis, M. 2002, ApJ, 572, 392 [NASA ADS] [CrossRef] [Google Scholar]
- Beri, A., & Paul, B. 2017, New Astron., 56, 94 [Google Scholar]
- Beri, A., Jain, C., Paul, B., & Raichur, H. 2014, MNRAS, 439, 1940 [NASA ADS] [CrossRef] [Google Scholar]
- Beri, A., Paul, B., & Dewangan, G. C. 2015, MNRAS, 451, 508 [NASA ADS] [CrossRef] [Google Scholar]
- Boldin, P. A., Tsygankov, S. S., & Lutovinov, A. A. 2013, Astron. Lett., 39, 375 [NASA ADS] [CrossRef] [Google Scholar]
- Bonanos, A. Z., Massa, D. L., Sewilo, M., et al. 2009, AJ, 138, 1003 [Google Scholar]
- Bozzo, E., Stella, L., Vietri, M., & Ghosh, P. 2009, A&A, 493, 809 [NASA ADS] [CrossRef] [EDP Sciences] [Google Scholar]
- Cannizzo, J. K. 1997, ApJ, 482, 178 [Google Scholar]
- Coburn, W., Heindl, W. A., Rothschild, R. E., et al. 2002, ApJ, 580, 394 [NASA ADS] [CrossRef] [Google Scholar]
- dal Fiume, D., Orlandini, M., Cusumano, G., et al. 1998, A&A, 329, L41 [Google Scholar]
- Dickey, J. M., & Lockman, F. J. 1990, ARA&A, 28, 215 [Google Scholar]
- Doroshenko, V., Santangelo, A., Ducci, L., & Klochkov, D. 2012, A&A, 548, A19 [NASA ADS] [CrossRef] [EDP Sciences] [Google Scholar]
- Ducci, L., Mereghetti, S., & Santangelo, A. 2019, ApJ, 881, L17 [NASA ADS] [CrossRef] [Google Scholar]
- Edge, W. R. T., Coe, M. J., Galache, J. L., & Hill, A. B. 2004, MNRAS, 349, 1361 [Google Scholar]
- Ferrigno, C., D’Aì, A., & Ambrosi, E. 2023, A&A, 677, A103 [NASA ADS] [CrossRef] [EDP Sciences] [Google Scholar]
- Galloway, D. K., Wang, Z., & Morgan, E. H. 2005, ApJ, 635, 1217 [NASA ADS] [CrossRef] [Google Scholar]
- Gendreau, K. C., Arzoumanian, Z., Adkins, P. W., et al. 2016, SPIE Conf. Ser., 9905, 99051H [NASA ADS] [Google Scholar]
- Ghosh, P., & Lamb, F. K. 1979, ApJ, 234, 296 [Google Scholar]
- Hickox, R. C., Narayan, R., & Kallman, T. R. 2004, ApJ, 614, 881 [NASA ADS] [CrossRef] [Google Scholar]
- James, M., Paul, B., Devasia, J., & Indulekha, K. 2011, MNRAS, 410, 1489 [Google Scholar]
- Ji, L., Ducci, L., Santangelo, A., et al. 2020, MNRAS, 493, 5680 [CrossRef] [Google Scholar]
- Kaastra, J. S., & Bleeker, J. A. M. 2016, A&A, 587, A151 [NASA ADS] [CrossRef] [EDP Sciences] [Google Scholar]
- Karaferias, A. S., Vasilopoulos, G., Petropoulou, M., et al. 2023, MNRAS, 520, 281 [NASA ADS] [CrossRef] [Google Scholar]
- Klochkov, D., Ferrigno, C., Santangelo, A., et al. 2011, A&A, 536, L8 [NASA ADS] [CrossRef] [EDP Sciences] [Google Scholar]
- Kuehnel, M., Finger, M. H., Fuerst, F., et al. 2014, ATel., 5856, 1 [Google Scholar]
- Kulkarni, A. K., & Romanova, M. M. 2008, MNRAS, 386, 673 [Google Scholar]
- Kumar, M., Sharma, R., Paul, B., & Rana, V. 2025, MNRAS, 536, 340 [Google Scholar]
- Leahy, D. A. 1987, A&A, 180, 275 [NASA ADS] [Google Scholar]
- Liu, Q. Z., van Paradijs, J., & van den Heuvel, E. P. J. 2006, A&A, 455, 1165 [NASA ADS] [CrossRef] [EDP Sciences] [Google Scholar]
- Lutovinov, A. A., & Tsygankov, S. S. 2009, Astron. Lett., 35, 433 [NASA ADS] [CrossRef] [Google Scholar]
- Lyubarskii, Y. E. 1997, MNRAS, 292, 679 [Google Scholar]
- Maitra, C., & Paul, B. 2013, ApJ, 763, 79 [NASA ADS] [CrossRef] [Google Scholar]
- Maitra, C., Paul, B., Haberl, F., & Vasilopoulos, G. 2018, MNRAS, 480, L136 [NASA ADS] [CrossRef] [Google Scholar]
- Makishima, K., Mihara, T., Ishida, M., et al. 1990, ApJ, 365, L59 [NASA ADS] [CrossRef] [Google Scholar]
- Malacaria, C., Jenke, P., Roberts, O. J., et al. 2020, ApJ, 896, 90 [NASA ADS] [CrossRef] [Google Scholar]
- Matsuoka, M., Kawasaki, K., Ueno, S., et al. 2009, PASJ, 61, 999 [Google Scholar]
- Mihara, T., Makishima, K., Ohashi, T., Sakao, T., & Tashiro, M. 1990, Nature, 346, 250 [NASA ADS] [CrossRef] [Google Scholar]
- Misra, R., Roy, J., & Yadav, J. S. 2021, J. Astrophys. Astron., 42, 55 [Google Scholar]
- Moon, D.-S., & Eikenberry, S. S. 2001, ApJ, 549, L225 [NASA ADS] [CrossRef] [Google Scholar]
- Moon, D.-S., Eikenberry, S. S., & Wasserman, I. M. 2003, ApJ, 582, L91 [NASA ADS] [CrossRef] [Google Scholar]
- Mushtukov, A., & Tsygankov, S. 2022, ArXiv e-prints [arXiv:2204.14185] [Google Scholar]
- Mushtukov, A. A., Suleimanov, V. F., Tsygankov, S. S., & Poutanen, J. 2015, MNRAS, 447, 1847 [NASA ADS] [CrossRef] [Google Scholar]
- Naik, S., & Paul, B. 2004, ApJ, 600, 351 [Google Scholar]
- Paul, B., Nagase, F., Endo, T., et al. 2002, ApJ, 579, 411 [NASA ADS] [CrossRef] [Google Scholar]
- Pietrzyński, G., Graczyk, D., Gieren, W., et al. 2013, Nature, 495, 76 [Google Scholar]
- Postnov, K., Staubert, R., Santangelo, A., et al. 2008, A&A, 480, L21 [NASA ADS] [CrossRef] [EDP Sciences] [Google Scholar]
- Pringle, J. E., & Rees, M. J. 1972, A&A, 21, 1 [NASA ADS] [Google Scholar]
- Reig, P. 2008, A&A, 489, 725 [NASA ADS] [CrossRef] [EDP Sciences] [Google Scholar]
- Reig, P. 2011, Ap&SS, 332, 1 [Google Scholar]
- Reig, P., Belloni, T., Israel, G. L., et al. 2008, A&A, 485, 797 [NASA ADS] [CrossRef] [EDP Sciences] [Google Scholar]
- Remillard, R. A., Loewenstein, M., Steiner, J. F., et al. 2022, AJ, 163, 130 [NASA ADS] [CrossRef] [Google Scholar]
- Revnivtsev, M., Churazov, E., Postnov, K., & Tsygankov, S. 2009, A&A, 507, 1211 [CrossRef] [EDP Sciences] [Google Scholar]
- Rolleston, W. R. J., Trundle, C., & Dufton, P. L. 2002, A&A, 396, 53 [NASA ADS] [CrossRef] [EDP Sciences] [Google Scholar]
- Romanova, M. M., Kulkarni, A. K., & Lovelace, R. V. E. 2008, ApJ, 673, L171 [Google Scholar]
- Schmidtke, P. C., Cowley, A. P., Frattare, L. M., et al. 1994, PASP, 106, 843 [NASA ADS] [CrossRef] [Google Scholar]
- Semena, A. N., Mereminskiy, I. A., Lutovinov, A. A., et al. 2024, ATel., 16562, 1 [Google Scholar]
- Sharma, R., Jain, C., & Paul, B. 2023a, MNRAS, 526, L35 [NASA ADS] [CrossRef] [Google Scholar]
- Sharma, R., Jain, C., Rikame, K., & Paul, B. 2023b, MNRAS, 519, 1764 [Google Scholar]
- Sharma, R., Gendreau, K., Arzoumanian, Z., et al. 2024a, ATel., 16569, 1 [Google Scholar]
- Sharma, R., Mandal, M., Pal, S., et al. 2024b, MNRAS, 534, 1028 [Google Scholar]
- Sharma, R., Jain, C., Paul, B., & Beri, A. 2025, MNRAS, 538, 1046 [Google Scholar]
- Shtykovsky, A. E., Arefiev, V. A., Lutovinov, A. A., & Molkov, S. V. 2018, Astron. Lett., 44, 149 [Google Scholar]
- Singh, K. P., Tandon, S. N., Agrawal, P. C., et al. 2014, SPIE Conf. Ser., 9144, 91441S [Google Scholar]
- Singh, K. P., Stewart, G. C., Chandra, S., et al. 2016, SPIE Conf. Ser., 9905, 99051E [NASA ADS] [Google Scholar]
- Singh, K. P., Stewart, G. C., Westergaard, N. J., et al. 2017, J. Astrophys. Astron., 38, 29 [NASA ADS] [CrossRef] [Google Scholar]
- Sugizaki, M., Mihara, T., Nakajima, M., & Makishima, K. 2017, PASJ, 69, 100 [NASA ADS] [CrossRef] [Google Scholar]
- Taam, R. E., Fryxell, B. A., & Brown, D. A. 1988, ApJ, 331, L117 [Google Scholar]
- Tendulkar, S. P., Fürst, F., Pottschmidt, K., et al. 2014, ApJ, 795, 154 [Google Scholar]
- Vasilopoulos, G., Haberl, F., Sturm, R., Maggi, P., & Udalski, A. 2014a, A&A, 567, A129 [NASA ADS] [CrossRef] [EDP Sciences] [Google Scholar]
- Vasilopoulos, G., Sturm, R., Maggi, P., & Haberl, F. 2014b, ATel., 5760, 1 [Google Scholar]
- Vasilopoulos, G., Haberl, F., Delvaux, C., Sturm, R., & Udalski, A. 2016, MNRAS, 461, 1875 [NASA ADS] [CrossRef] [Google Scholar]
- Virtanen, P., Gommers, R., Oliphant, T. E., et al. 2020, Nat. Methods, 17, 261 [Google Scholar]
- Wilms, J., Allen, A., & McCray, R. 2000, ApJ, 542, 914 [Google Scholar]
- Wilson-Hodge, C. A., Malacaria, C., Jenke, P. A., et al. 2018, ApJ, 863, 9 [Google Scholar]
- Woods, P. M., Kouveliotou, C., van Paradijs, J., et al. 2000, ApJ, 540, 1062 [Google Scholar]
- Yadav, J. S., Agrawal, P. C., Antia, H. M., et al. 2016, SPIE Conf. Ser., 9905, 99051D [NASA ADS] [Google Scholar]
- Yang, H. N., Maitra, C., Vasilopoulos, G., et al. 2025, MNRAS, 536, 1357 [Google Scholar]
- Zhang, Y. J., Wang, C. Y., Liu, Y., et al. 2024, ATel., 16571, 1 [Google Scholar]
Appendix A: Spin frequencies and energy-resolved profiles
Barycenter-corrected and orbital-corrected spin frequency measurements. All errors reported in this table are at 68% (1σ) confidence level.
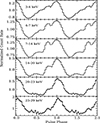 |
Fig. A.1. Comparison of pulse profiles in different energy bands: 3–4 keV, 4–7 keV, 7–14 keV, 14–20 keV, 20–23 keV, and 23–25 keV. |
All Tables
Spin ephemeris parameters derived from the AstroSat/LAXPC observation along with the evolution of the spin frequency during the 2024 outburst based on the measurements from NICER, AstroSat, and NuSTAR observations.
Best-fit spectral parameters of RX J0520.5–6932 using the model tbabs*tbvarabs*(blackbody + Gaussian + highecut*powerlaw*cyclabs).
Barycenter-corrected and orbital-corrected spin frequency measurements. All errors reported in this table are at 68% (1σ) confidence level.
All Figures
|
Fig. 1. Light curve of RX J0520.5–6932 in the 2–20 keV energy band during its 2024 outburst from MAXI-GSC binned at two days. The MAXI data points represent the source intensity, whereas the vertical solid red line marks the epoch of AstroSat observation, and the blue tick markers indicate the epoch of NICER pointings. |
| In the text | |
|
Fig. 2. AstroSat/LAXPC light curve of RX J0520.5–6932 during its 2024 outburst in the 3–25 keV energy range, binned at 50 seconds. The bottom subplot highlights a zoomed-in segment of the light curve (from the second orbit) showing short-timescale flaring events, where different colors (red, cyan, and green) mark pre-flare, flare, and post-flare intervals, respectively. The bottom panel of each subplot displays the hardness ratio, defined as the ratio of count rates in the 8–25 keV and 3–8 keV energy bands. The shaded region highlights the detected flaring events. |
| In the text | |
|
Fig. 3. Power density spectrum of RX J0520.5–6932 in the 3–25 keV band obtained from AstroSat/LAXPC data. The continuum was modeled using a combination of three Lorentzian components representing broad noise features at different characteristic frequencies. Sharp peaks due to the neutron star’s spin frequency and its harmonics were excluded from the fit. |
| In the text | |
|
Fig. 4. Spin frequency evolution of RX J0520.5–6932 during the 2024 outburst. Top: Barycenter-corrected spin frequencies from NICER, AstroSat, Fermi/GBM and NuSTAR, overlaid with the composite model ν(t) = νint(t)−νorb(t) (solid red line), which combines the intrinsic quadratic spin evolution with the fixed orbital parameters from Yang et al. (2025) (Solution II). Middle: Spin frequencies after correcting for orbital motion. A quadratic model (solid line) fits all data points and captures the evolving spin-up trend, while a linear model (dashed line) fits only the early part of the outburst (excluding the final NICER point). Bottom: Residuals of the quadratic and linear fits. The residuals clearly favor the quadratic model, supporting the presence of a varying spin-up rate during the outburst. |
| In the text | |
|
Fig. 5. Energy-resolved dynamic pulse profiles of RX J0520.5–6932 obtained from AstroSat/LAXPC data during the 2024 outburst. The color map represents the normalized pulse intensity across different energy bands. Strong energy dependence is evident, with the secondary peak most prominent in the 7–14 keV range and broadening of off-pulse appearing at higher energies. The energy-average pulse profile is overplotted as a dashed line. |
| In the text | |
|
Fig. 6. Pulse profiles in the 0.5–10 keV energy range from individual NICER observations folded using the respective spin frequencies reported in Table A.1. The profiles are phase-aligned such that the main peak is centered around phase 1. The corresponding obsID, date (in MJD), and pulsed fraction (PFrms) are mentioned at the top and bottom of each panel, respectively. |
| In the text | |
|
Fig. 7. Energy-resolved pulse profile from NICER observations. The corresponding obsID and date (in MJD) are mentioned on top of each figure. The corresponding pulsed fraction (PFrms) in each selected energy range is mentioned in each subpanel. |
| In the text | |
|
Fig. 8. Energy dependence of the rms pulsed fraction, derived from simultaneous AstroSat/LAXPC and NICER observations. The pulsed fraction shows a clear increasing trend with energy. |
| In the text | |
|
Fig. 9. Intensity-resolved and flare-resolved pulse profiles of RX J0520.5–6932 from AstroSat/LAXPC during the 2024 outburst. Left: Dynamic pulse profiles across different intensity intervals. The color map shows normalized pulse shapes, revealing notable structural changes in pulse morphology. The intensity-average pulse profile is overplotted as a dashed line for comparison. Right: Pulse profiles extracted for three distinct flux states identified in Fig. 2: pre-flare, flare, and post-flare intervals. The secondary peak is clearly visible before and after the flare but disappears during the flare, suggesting a change in the emission geometry. |
| In the text | |
|
Fig. 10. Broadband X-ray spectrum of RX J0520.5–6932 from NICER, SXT, and LAXPC with residuals illustrating the contributions of key spectral components. (a): Unfolded spectrum fit with the model tbabs*tbvarabs*(bbodyrad + Gaussian + highecut*powerlaw*cyclabs). (b) Residuals (χ = (data-model)/error) after fitting without the cyclabs model. (c) Residuals after fitting without the 1 keV Gaussian emission line. (d) Residuals from the final best-fit model. |
| In the text | |
|
Fig. 11. Temporal variation of the best-fit spectral parameters of RX J0520.5–6932 from individual NICER observations during the 2024 outburst. The panels show (from top to bottom) the LMC Column density ( |
| In the text | |
|
Fig. A.1. Comparison of pulse profiles in different energy bands: 3–4 keV, 4–7 keV, 7–14 keV, 14–20 keV, 20–23 keV, and 23–25 keV. |
| In the text | |
Current usage metrics show cumulative count of Article Views (full-text article views including HTML views, PDF and ePub downloads, according to the available data) and Abstracts Views on Vision4Press platform.
Data correspond to usage on the plateform after 2015. The current usage metrics is available 48-96 hours after online publication and is updated daily on week days.
Initial download of the metrics may take a while.