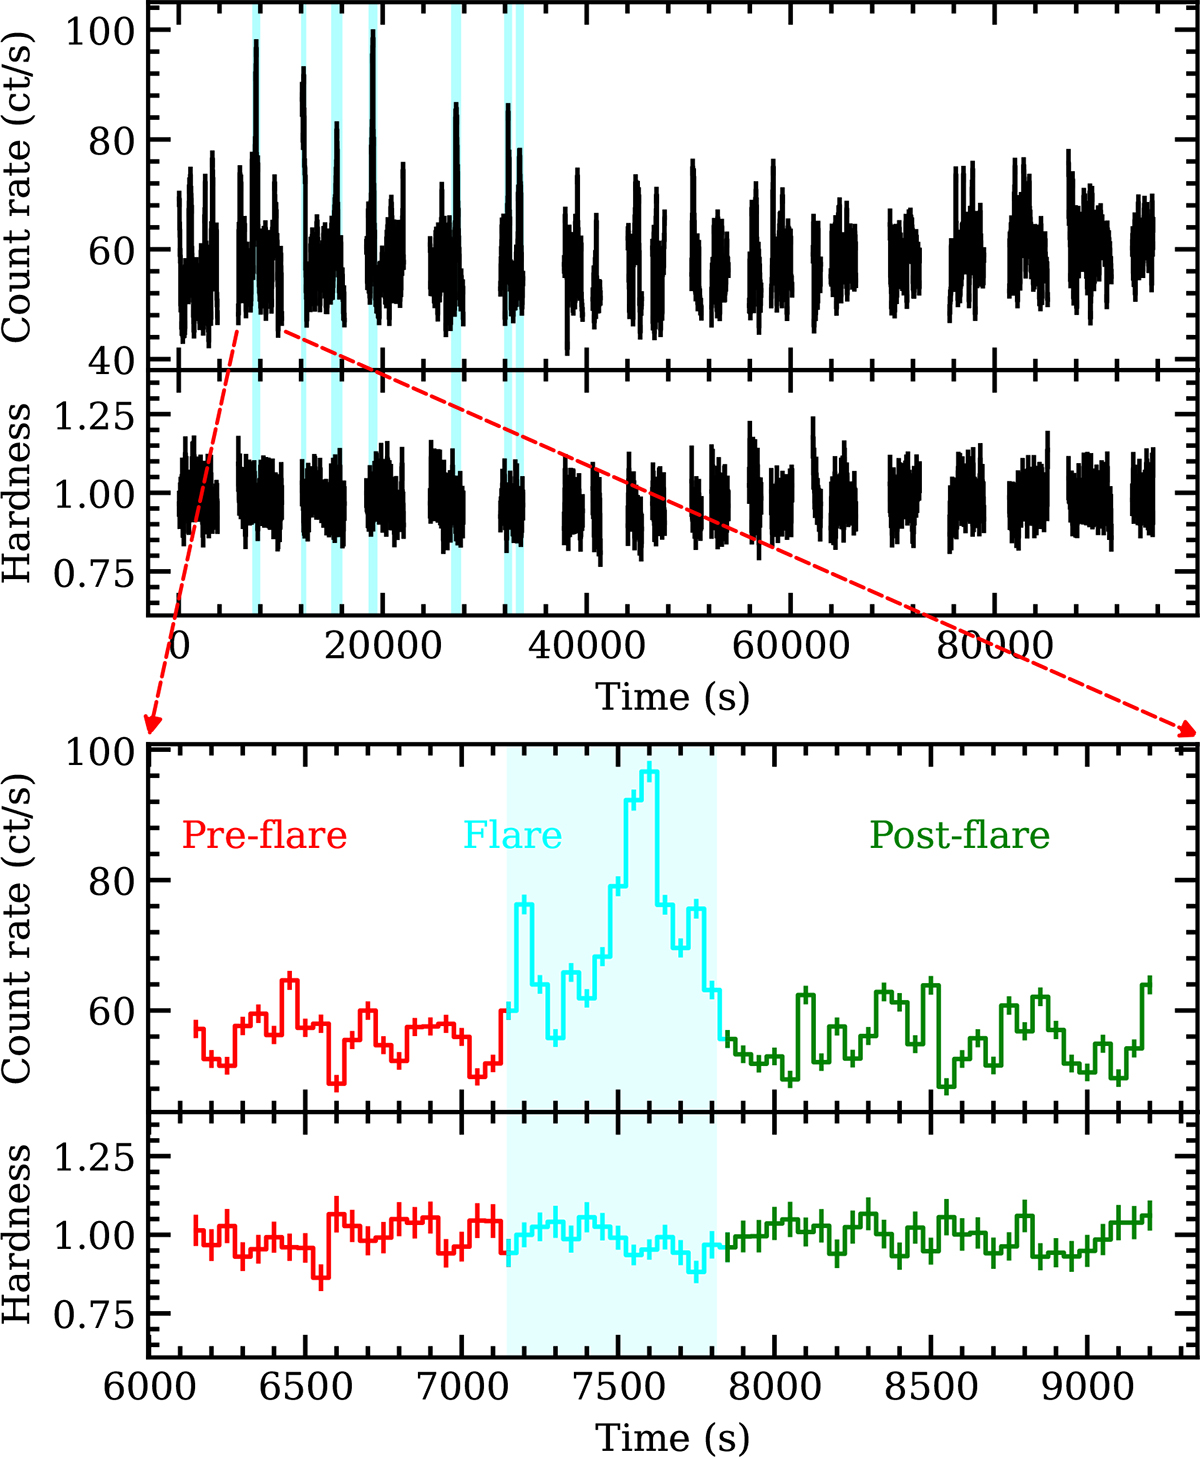
Fig. 2.
Download original image
AstroSat/LAXPC light curve of RX J0520.5–6932 during its 2024 outburst in the 3–25 keV energy range, binned at 50 seconds. The bottom subplot highlights a zoomed-in segment of the light curve (from the second orbit) showing short-timescale flaring events, where different colors (red, cyan, and green) mark pre-flare, flare, and post-flare intervals, respectively. The bottom panel of each subplot displays the hardness ratio, defined as the ratio of count rates in the 8–25 keV and 3–8 keV energy bands. The shaded region highlights the detected flaring events.
Current usage metrics show cumulative count of Article Views (full-text article views including HTML views, PDF and ePub downloads, according to the available data) and Abstracts Views on Vision4Press platform.
Data correspond to usage on the plateform after 2015. The current usage metrics is available 48-96 hours after online publication and is updated daily on week days.
Initial download of the metrics may take a while.