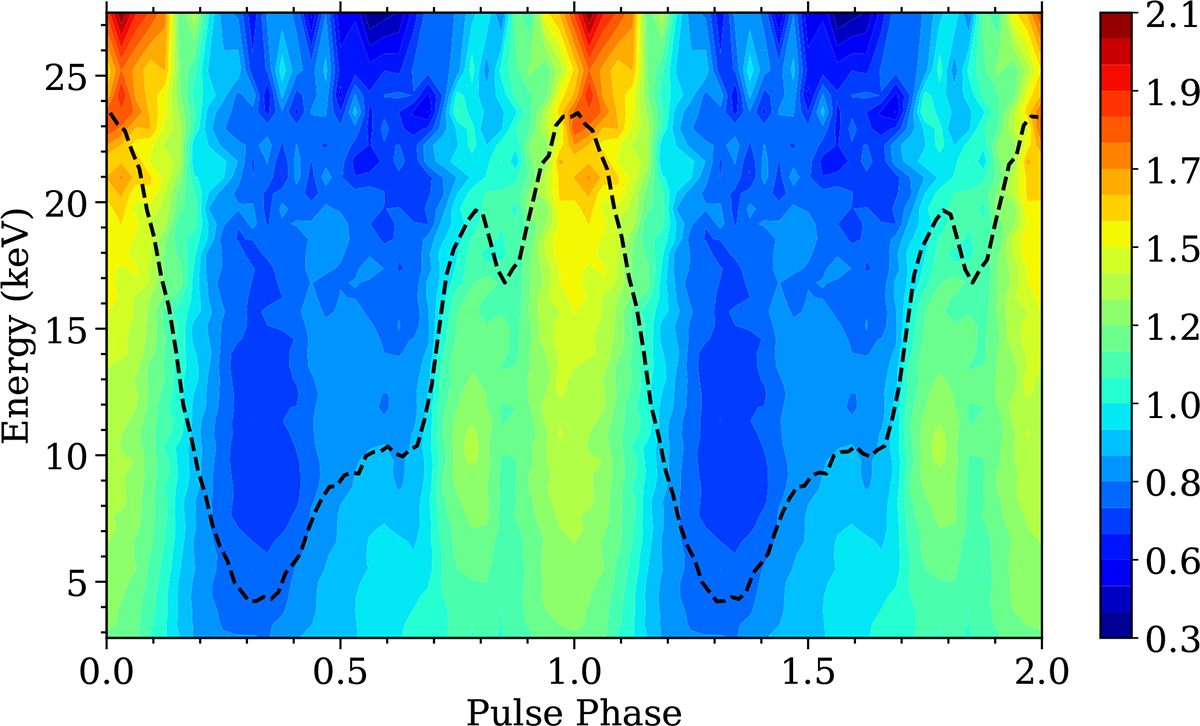
Fig. 5.
Download original image
Energy-resolved dynamic pulse profiles of RX J0520.5–6932 obtained from AstroSat/LAXPC data during the 2024 outburst. The color map represents the normalized pulse intensity across different energy bands. Strong energy dependence is evident, with the secondary peak most prominent in the 7–14 keV range and broadening of off-pulse appearing at higher energies. The energy-average pulse profile is overplotted as a dashed line.
Current usage metrics show cumulative count of Article Views (full-text article views including HTML views, PDF and ePub downloads, according to the available data) and Abstracts Views on Vision4Press platform.
Data correspond to usage on the plateform after 2015. The current usage metrics is available 48-96 hours after online publication and is updated daily on week days.
Initial download of the metrics may take a while.