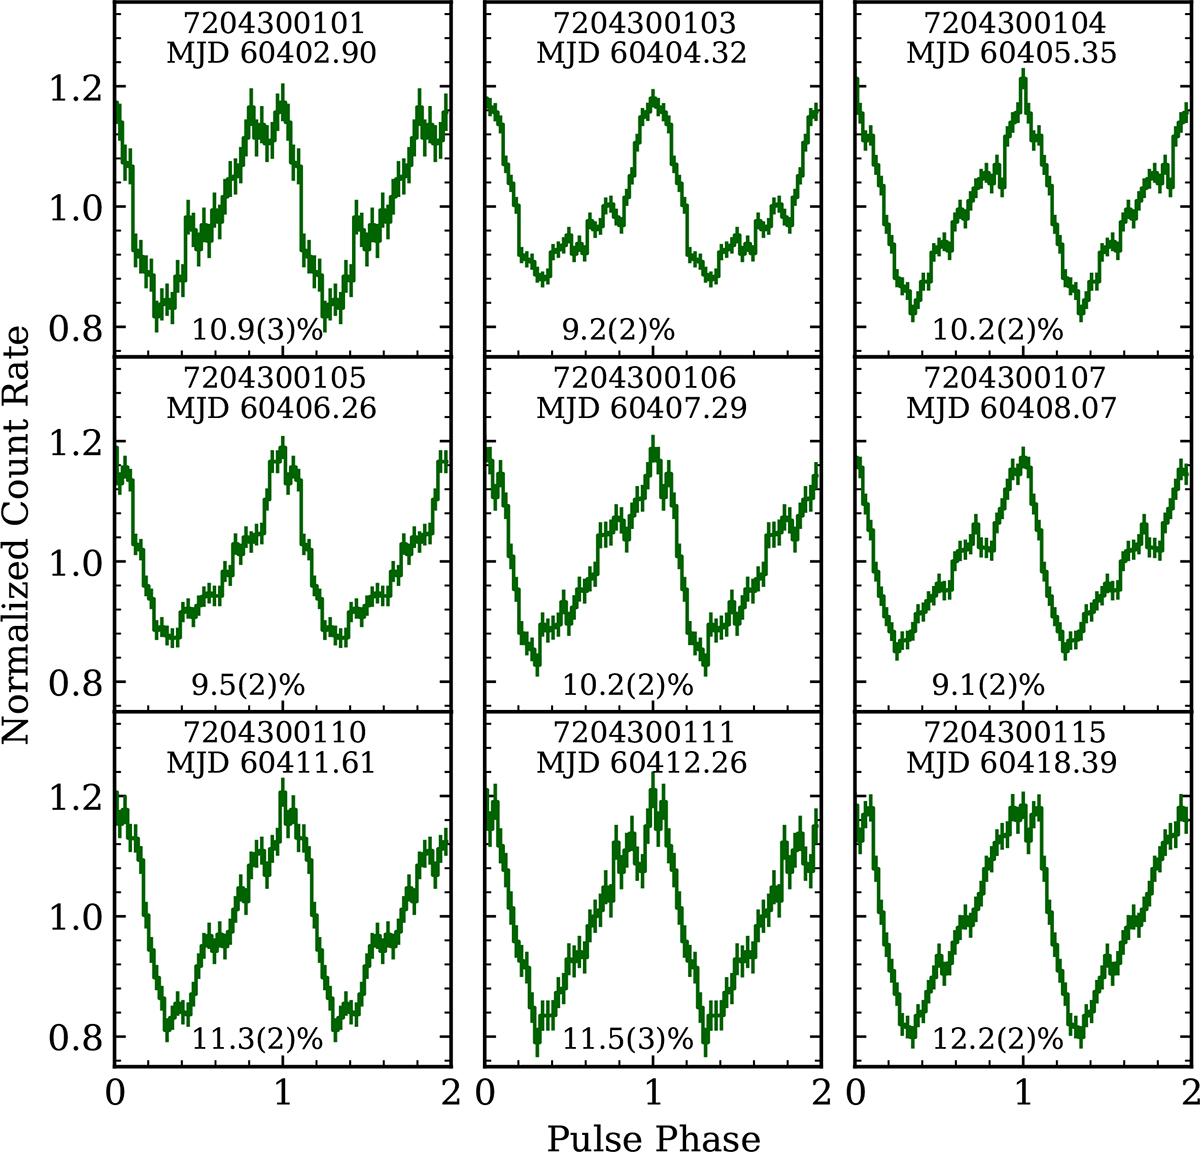
Fig. 6.
Download original image
Pulse profiles in the 0.5–10 keV energy range from individual NICER observations folded using the respective spin frequencies reported in Table A.1. The profiles are phase-aligned such that the main peak is centered around phase 1. The corresponding obsID, date (in MJD), and pulsed fraction (PFrms) are mentioned at the top and bottom of each panel, respectively.
Current usage metrics show cumulative count of Article Views (full-text article views including HTML views, PDF and ePub downloads, according to the available data) and Abstracts Views on Vision4Press platform.
Data correspond to usage on the plateform after 2015. The current usage metrics is available 48-96 hours after online publication and is updated daily on week days.
Initial download of the metrics may take a while.