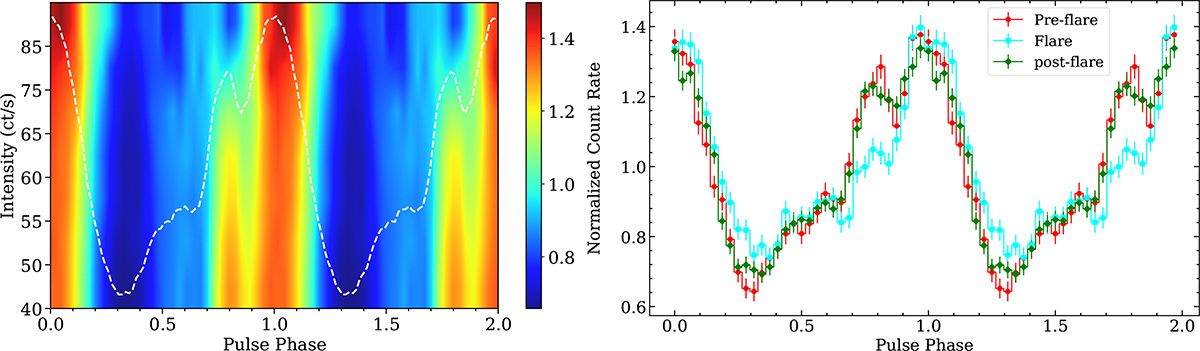
Fig. 9.
Download original image
Intensity-resolved and flare-resolved pulse profiles of RX J0520.5–6932 from AstroSat/LAXPC during the 2024 outburst. Left: Dynamic pulse profiles across different intensity intervals. The color map shows normalized pulse shapes, revealing notable structural changes in pulse morphology. The intensity-average pulse profile is overplotted as a dashed line for comparison. Right: Pulse profiles extracted for three distinct flux states identified in Fig. 2: pre-flare, flare, and post-flare intervals. The secondary peak is clearly visible before and after the flare but disappears during the flare, suggesting a change in the emission geometry.
Current usage metrics show cumulative count of Article Views (full-text article views including HTML views, PDF and ePub downloads, according to the available data) and Abstracts Views on Vision4Press platform.
Data correspond to usage on the plateform after 2015. The current usage metrics is available 48-96 hours after online publication and is updated daily on week days.
Initial download of the metrics may take a while.