Fig. 1
Download original image
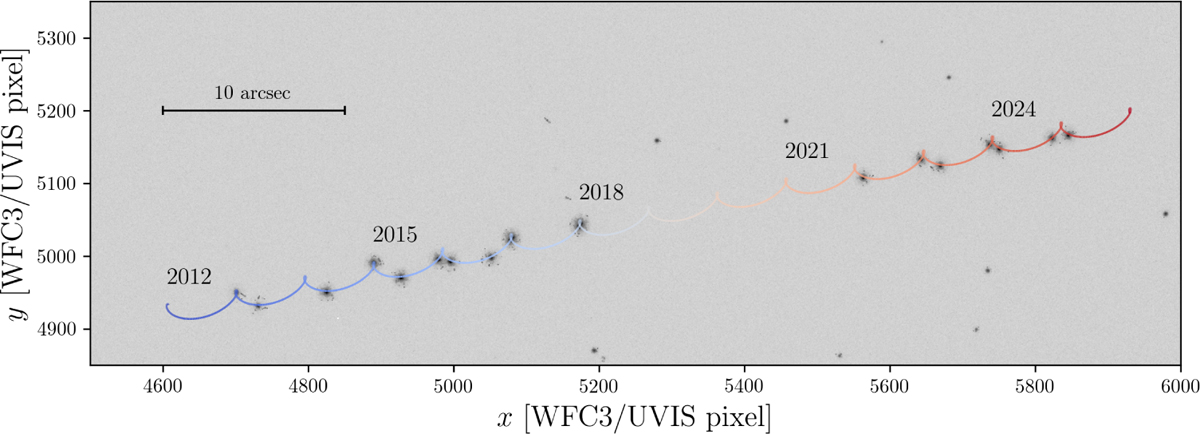
Composite image of Proxima obtained by co-adding all HST exposures, properly normalized, from October 2012 to February 2025. The colored line represents the motion of Proxima predicted by our astrometric fit (see Sect. 3.3), with the color changing from blue to white to red as the epoch increases (see also labels in the plot). North is up and east is to the left.
Current usage metrics show cumulative count of Article Views (full-text article views including HTML views, PDF and ePub downloads, according to the available data) and Abstracts Views on Vision4Press platform.
Data correspond to usage on the plateform after 2015. The current usage metrics is available 48-96 hours after online publication and is updated daily on week days.
Initial download of the metrics may take a while.