Fig. 4
Download original image
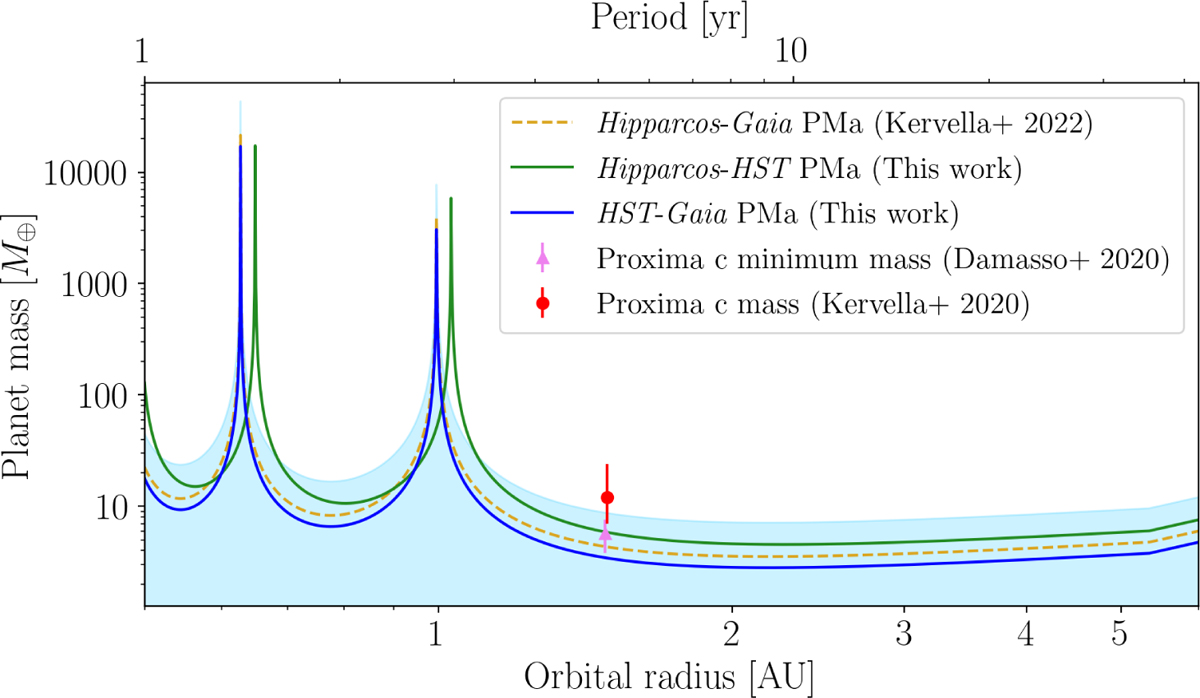
Expected mass of Proxima c as a function of its orbital radius derived from the PMa analysis. The solid blue line shows the mass estimate obtained in this work from the combination of HST and Gaia-DR3 astrometry, with the shaded light-blue region representing the 1σ uncertainty. The relation obtained combining Hip-Gaia (marked just as “HIPPARCOS” in the plot legend for clarity) and part of the HST data is shown as a solid green line. The dashed yellow line represents the PMa-based relation obtained by Kervella et al. (2022) using HIPPARCOS and Gaia. The pink triangle marks the minimum mass derived of Proxima c from Damasso et al. (2020). The red point shows the mass estimate from Kervella et al. (2020).
Current usage metrics show cumulative count of Article Views (full-text article views including HTML views, PDF and ePub downloads, according to the available data) and Abstracts Views on Vision4Press platform.
Data correspond to usage on the plateform after 2015. The current usage metrics is available 48-96 hours after online publication and is updated daily on week days.
Initial download of the metrics may take a while.