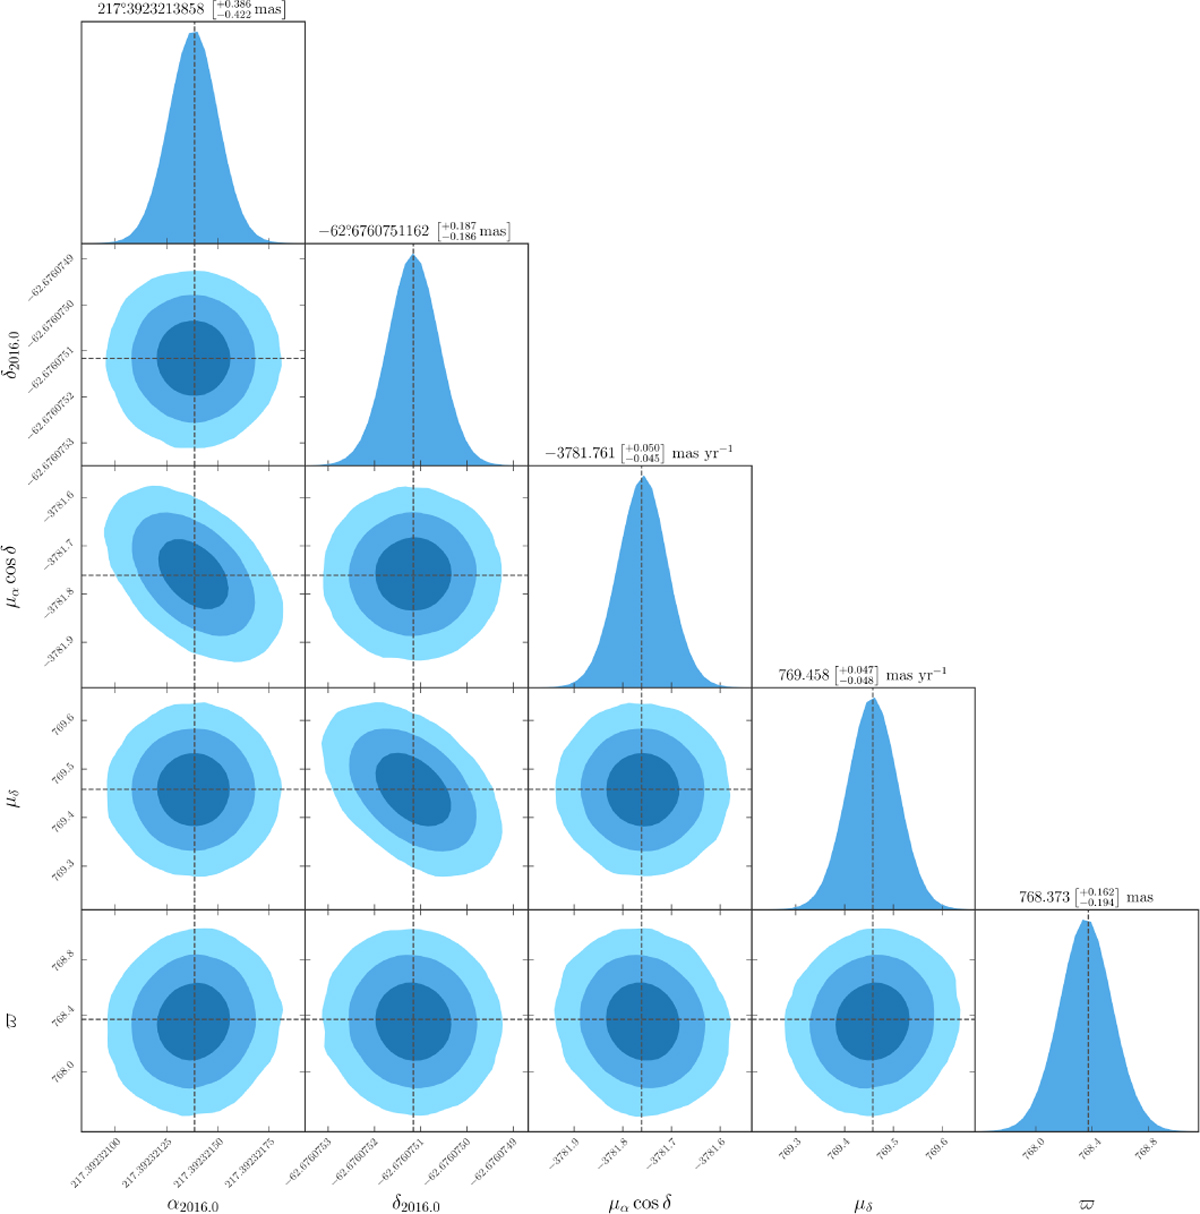
Fig. B.1
Download original image
1D (histograms) and 2D (marginalized) projections of the posterior-probability distributions of the astrometric parameters of Proxima. The dashed, gray lines set the best-fit parameters (also reported, with the corresponding uncertainties, above each histogram). The marginalized projections of the posterior-probability distributions show 1, 2, and 3 σ contour in different shades of blue.
Current usage metrics show cumulative count of Article Views (full-text article views including HTML views, PDF and ePub downloads, according to the available data) and Abstracts Views on Vision4Press platform.
Data correspond to usage on the plateform after 2015. The current usage metrics is available 48-96 hours after online publication and is updated daily on week days.
Initial download of the metrics may take a while.