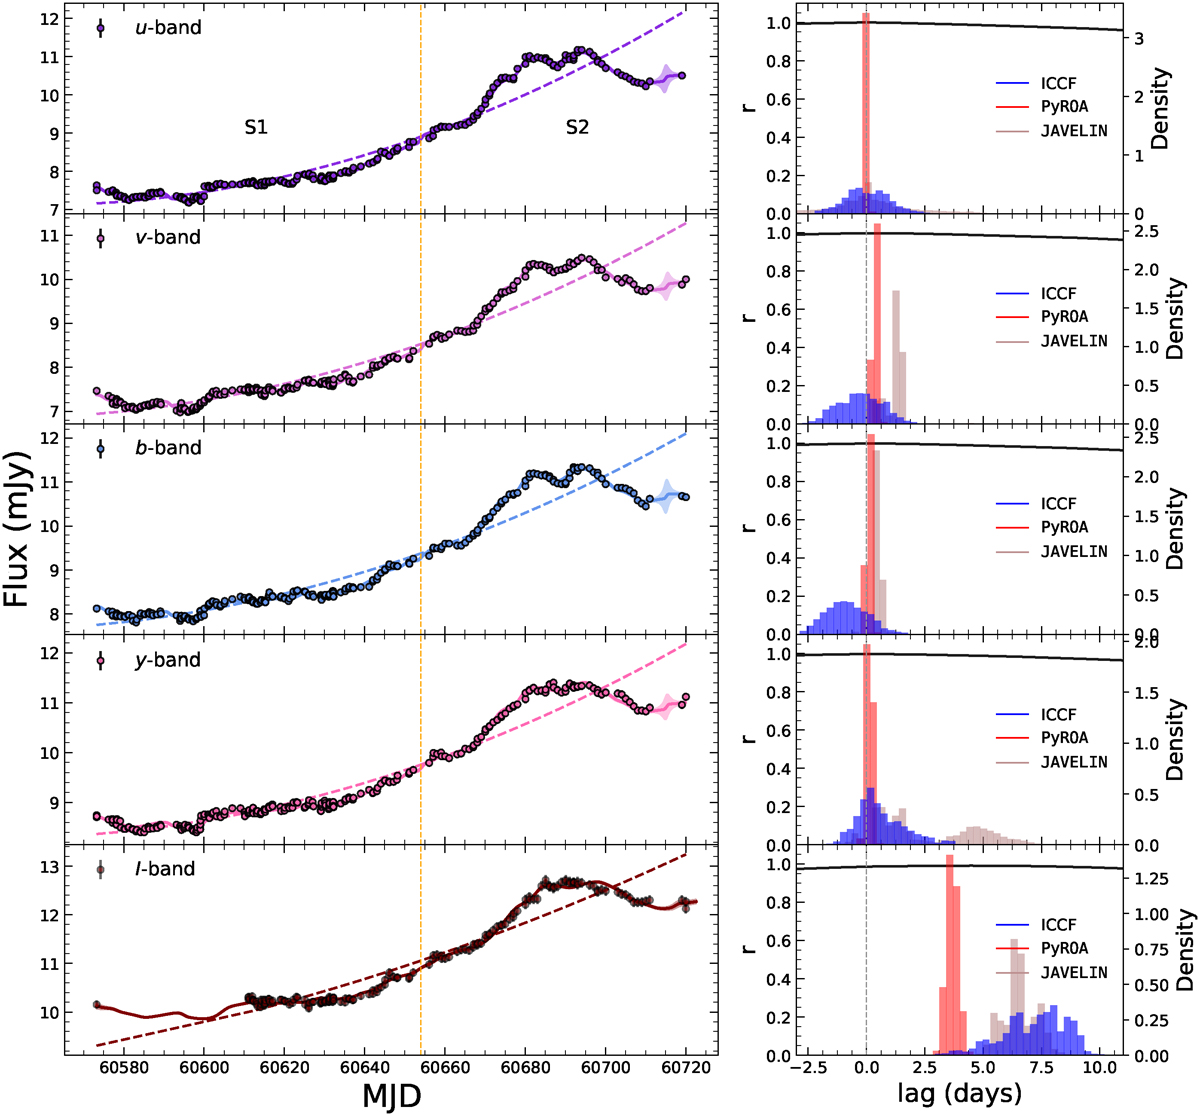
Fig. 2.
Download original image
Light curves from OCM monitoring and lag analysis. Left: Light curves of Fairall 9 in the u, v, b, y, and I filters, shown from top to bottom, respectively. In each panel, the dashed lines in various colors indicate second-order polynomial detrending, while the solid lines represent the best-fit light curves obtained from PyROA. The full light curve is divided into two segments, S1 and S2, separated by an observational gap indicated by the vertical dashed orange line. Right: Distribution of the cross-correlation coefficient relative to the u band (solid black line) derived using the ICCF method for the full, non-detrended original light curve. The blue histogram shows the cross-correlation centroid distribution from ICCF, the red histogram represents the lag probability distribution obtained from PyROA, and the brown histogram shows the corresponding distribution from JAVELIN. A vertical dashed gray line marks the reference point at τ = 0 days.
Current usage metrics show cumulative count of Article Views (full-text article views including HTML views, PDF and ePub downloads, according to the available data) and Abstracts Views on Vision4Press platform.
Data correspond to usage on the plateform after 2015. The current usage metrics is available 48-96 hours after online publication and is updated daily on week days.
Initial download of the metrics may take a while.