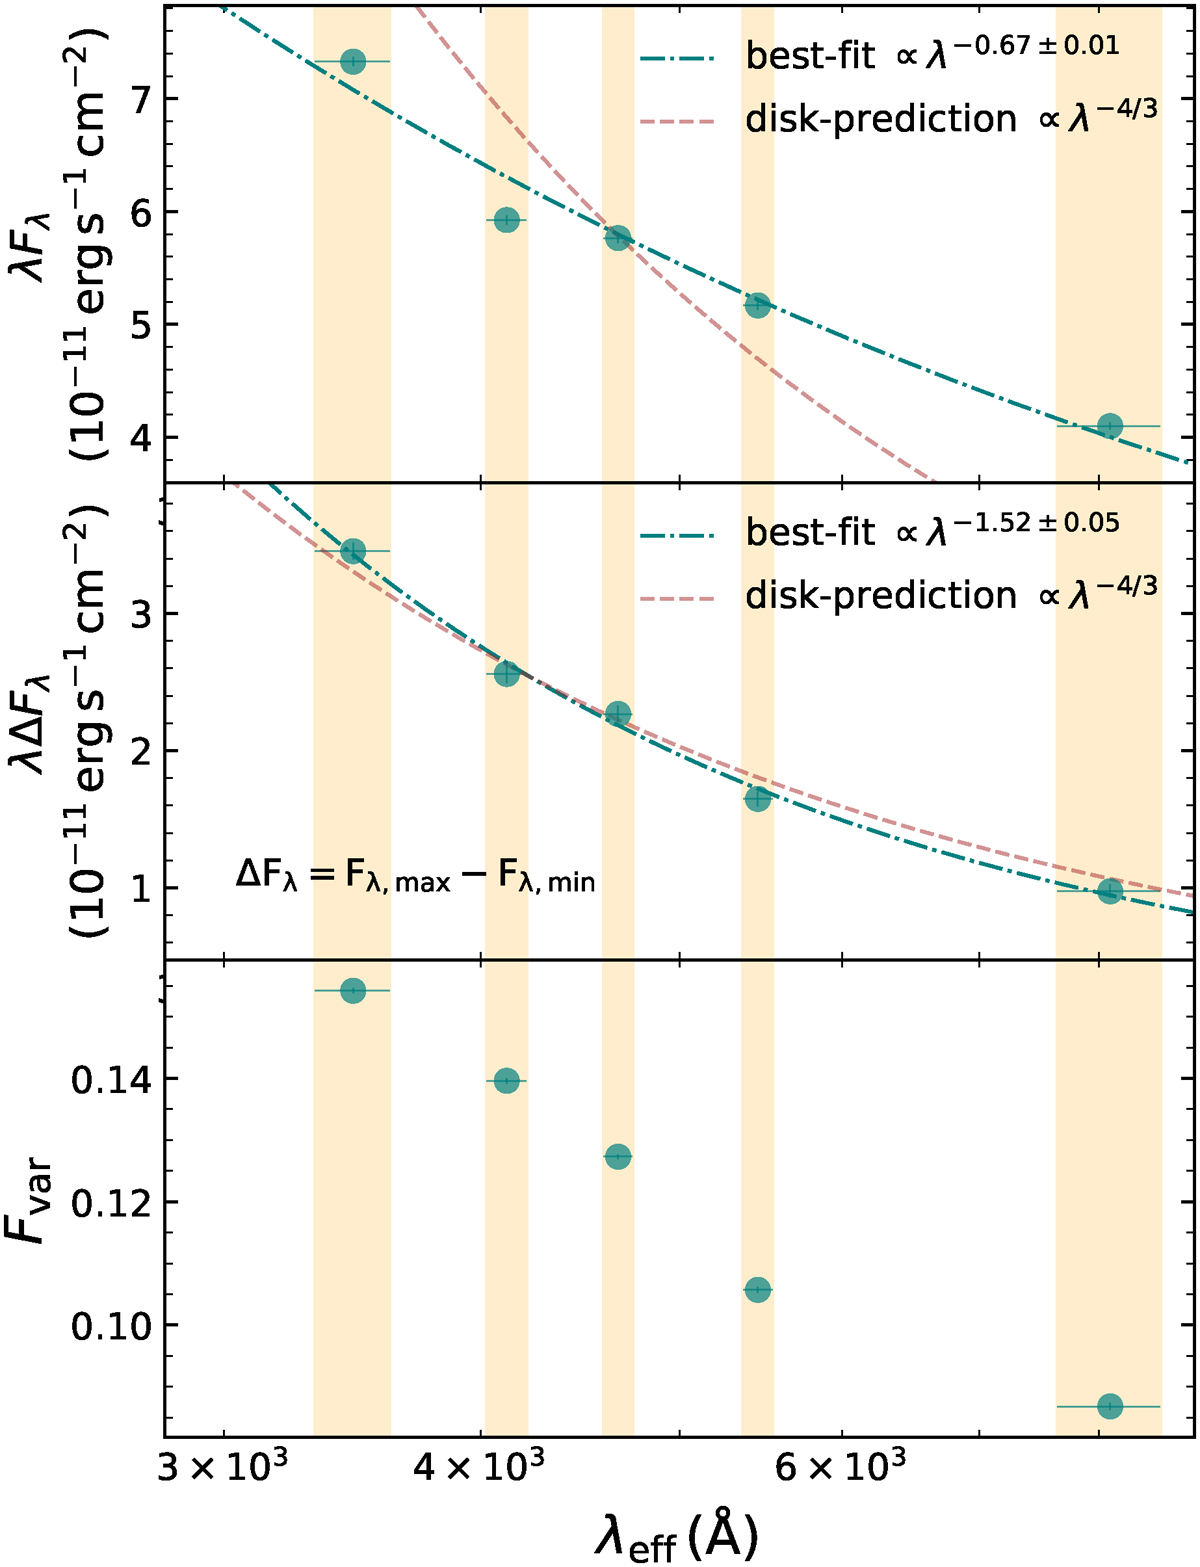
Fig. 3.
Download original image
Results from the photometric flux variability analysis. Top: Optical SED of Fairall 9 derived from the mean fluxes in the u, v, b, y, and I filters. Middle: Differential SED constructed from the difference between the maximum and minimum fluxes in the corresponding filters. Bottom: Normalized excess variance, Fvar, as a function of wavelength. In both the top and middle panels, the dot-dashed teal line represents the best-fit power law with a free spectral index, while the dashed brown line corresponds to a power law with the index fixed at −4/3, as predicted by the standard thin accretion disk model. The orange-shaded regions indicate the ±1σ range, representing the wavelength uncertainty of each filter, as quantified by the rms width of its transmission curve.
Current usage metrics show cumulative count of Article Views (full-text article views including HTML views, PDF and ePub downloads, according to the available data) and Abstracts Views on Vision4Press platform.
Data correspond to usage on the plateform after 2015. The current usage metrics is available 48-96 hours after online publication and is updated daily on week days.
Initial download of the metrics may take a while.