Fig. 5.
Download original image
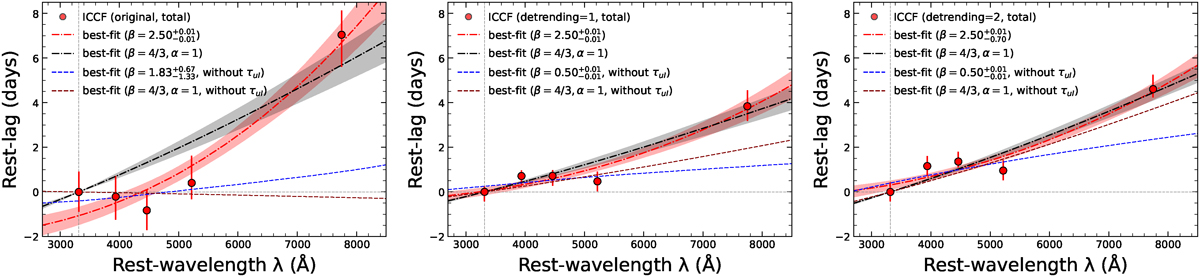
Examples of lag-spectra based on ICCF lag measurements using the complete light curves for three cases: original (left), detrended with order = 1 (middle), and detrended with order = 2 (right). The ICCF lag measurements (red circles) are shown in the rest-frame as a function of rest-frame wavelength. The dot-dashed red line represents the best-fit to the relation τ ∝ λβ using Equation (5), where τ0, β, and α are free parameters. The dot-dashed black line shows the best-fit with fixed β = 4/3 and α = 1 with only τ0 as a free parameter. Shaded regions indicate the 1σ uncertainties from the fitting. The blue and maroon dashed lines show the respective best-fits derived without including τuI in the lag-spectrum for the cases where all parameters (τ0, β, and α) are free and where β = 4/3 and α = 1 are fixed. Vertical and horizontal dotted lines mark the rest-frame reference wavelength and zero rest-lag, respectively.
Current usage metrics show cumulative count of Article Views (full-text article views including HTML views, PDF and ePub downloads, according to the available data) and Abstracts Views on Vision4Press platform.
Data correspond to usage on the plateform after 2015. The current usage metrics is available 48-96 hours after online publication and is updated daily on week days.
Initial download of the metrics may take a while.