Fig. 6.
Download original image
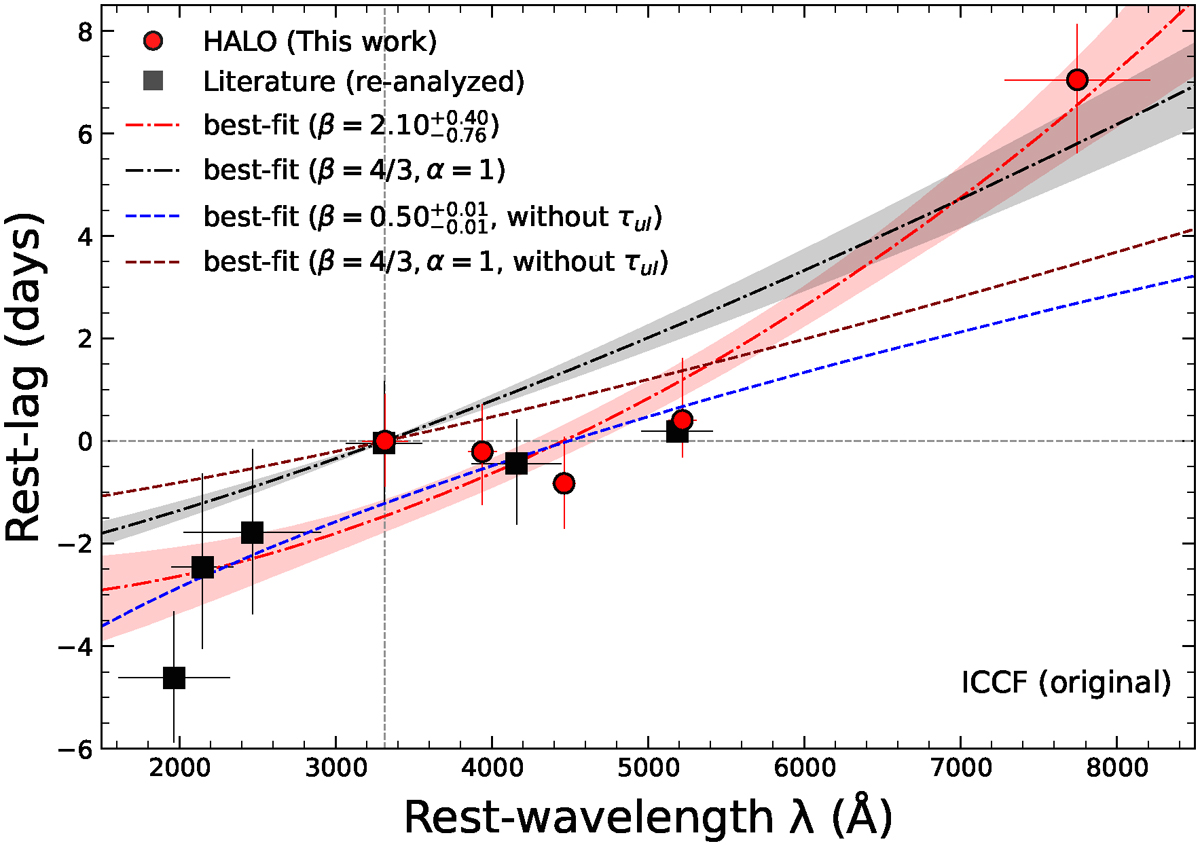
Combined lag–spectrum. Red circular points show our HALO measurements, while black square points indicate reanalyzed literature measurements based on the light curve data from Edelson et al. (2024). The horizontal error bars represent the rms width of the transmission curve as the filter’s wavelength uncertainty. The dot-dashed red and black lines, together with their shaded regions, represent the best-fit results from power-law lag–spectrum fitting, with β and α treated as free parameters and fixed at 4/3 and 1, respectively. The corresponding fits obtained excluding τuI from the lag-spectrum are shown by the dashed blue and maroon lines. The lag–spectrum shows a clear excess in the u and U bands, suggesting Balmer continuum contamination from the BLR in these bands.
Current usage metrics show cumulative count of Article Views (full-text article views including HTML views, PDF and ePub downloads, according to the available data) and Abstracts Views on Vision4Press platform.
Data correspond to usage on the plateform after 2015. The current usage metrics is available 48-96 hours after online publication and is updated daily on week days.
Initial download of the metrics may take a while.