Fig. 7.
Download original image
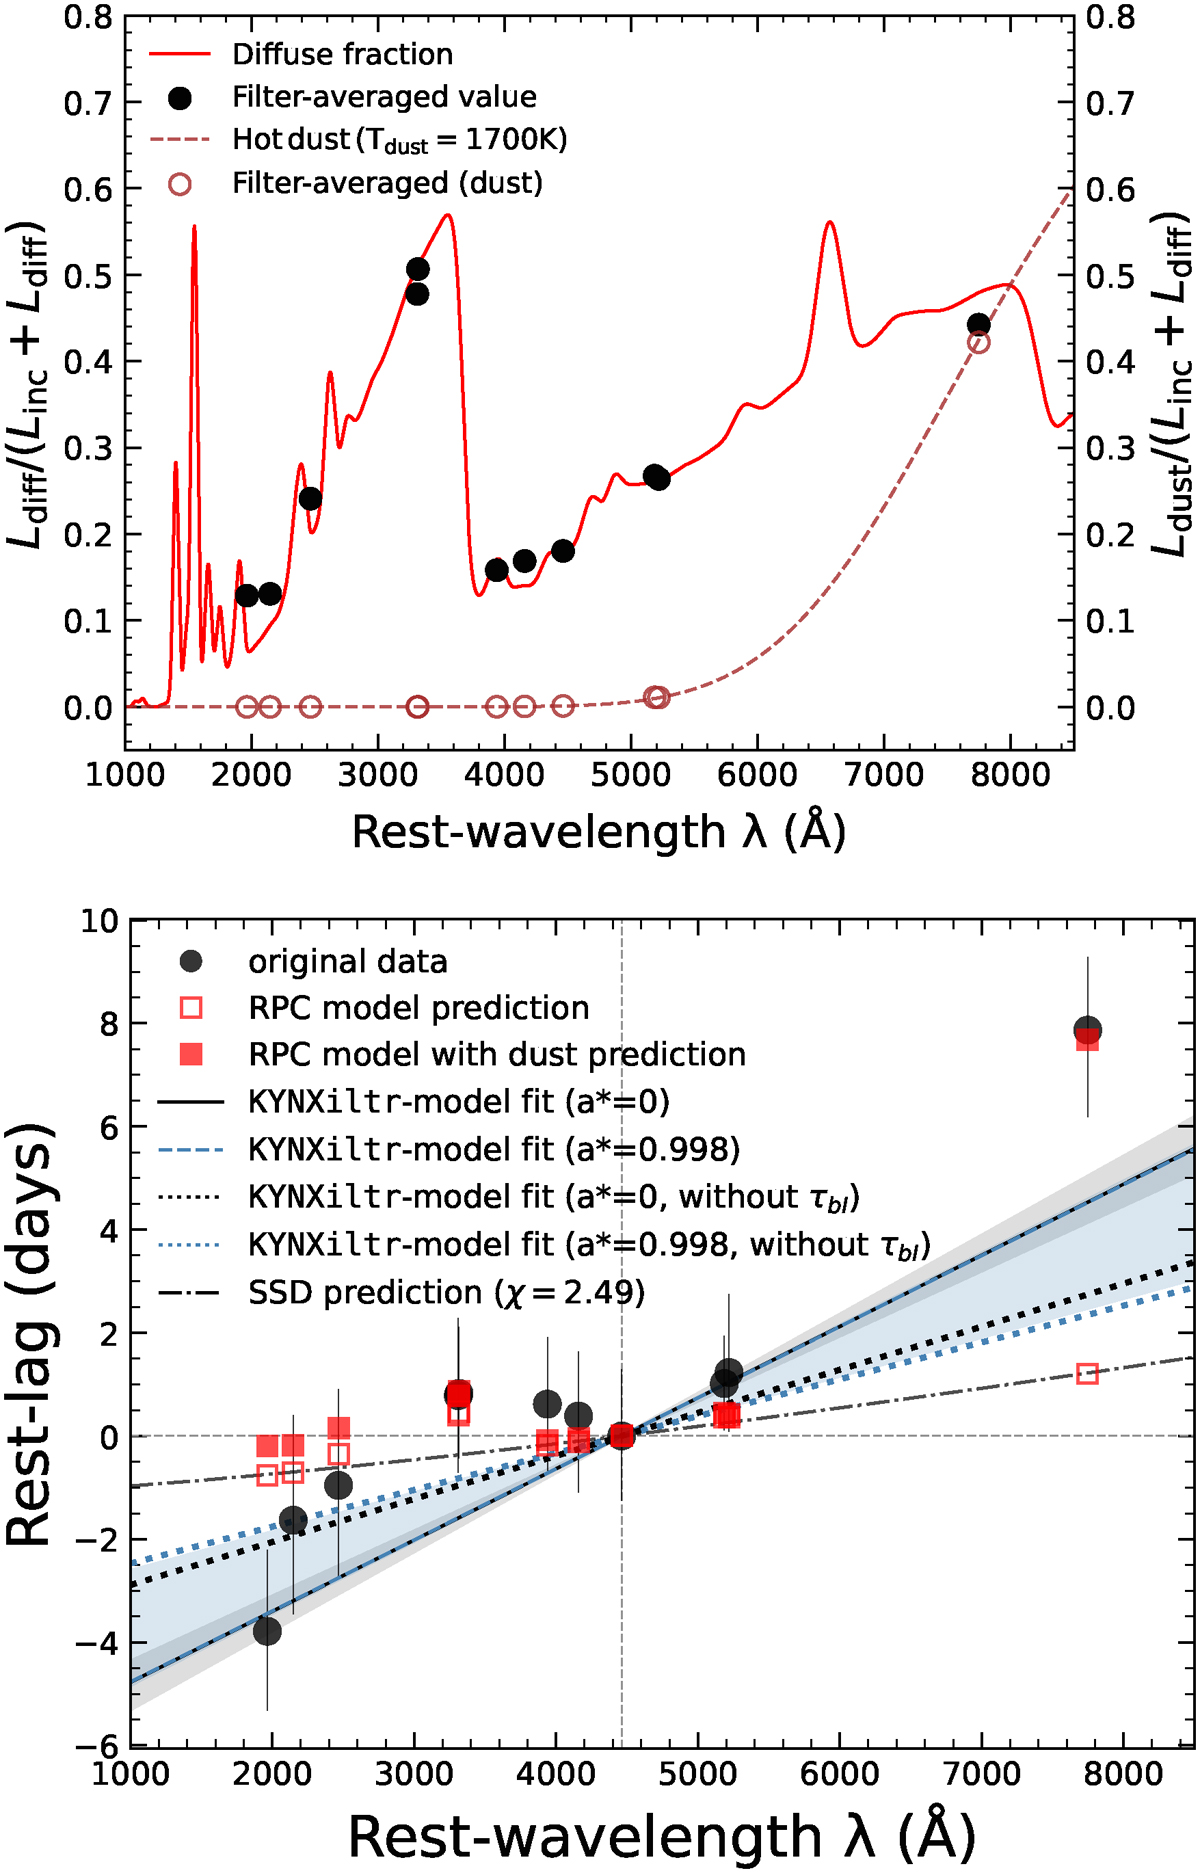
Lag-spectrum modeling. Top: Ratio ![]() , calculated from the emissivity profile of BLR clouds centered at log r (cm) = 16.65 from Cloudy, shown as a function of wavelength. Additionally, the dust fraction,
, calculated from the emissivity profile of BLR clouds centered at log r (cm) = 16.65 from Cloudy, shown as a function of wavelength. Additionally, the dust fraction, ![]() , is overplotted as a dashed brown line. Black and brown points indicate the corresponding values averaged over the response curves of the filters used to measure continuum delays, respectively. Bottom: Lag-spectrum of Fairall 9. Black points indicate the observed data; open red squares show the RPC-model recovered time delays; and solid red squares denote the RPC-model predictions when the contribution from hot torus dust is included in the continuum lags. Solid black and dashed blue lines represent the best-fit results from the KYNXiltr model for spin a * = 0 and a * = 0.998, respectively. The corresponding fits obtained after excluding τuI from the lag-spectrum are shown by dotted lines. The fit ranges for the full lag-spectrum fitting are indicated by the gray- and blue-shaded regions.
, is overplotted as a dashed brown line. Black and brown points indicate the corresponding values averaged over the response curves of the filters used to measure continuum delays, respectively. Bottom: Lag-spectrum of Fairall 9. Black points indicate the observed data; open red squares show the RPC-model recovered time delays; and solid red squares denote the RPC-model predictions when the contribution from hot torus dust is included in the continuum lags. Solid black and dashed blue lines represent the best-fit results from the KYNXiltr model for spin a * = 0 and a * = 0.998, respectively. The corresponding fits obtained after excluding τuI from the lag-spectrum are shown by dotted lines. The fit ranges for the full lag-spectrum fitting are indicated by the gray- and blue-shaded regions.
Current usage metrics show cumulative count of Article Views (full-text article views including HTML views, PDF and ePub downloads, according to the available data) and Abstracts Views on Vision4Press platform.
Data correspond to usage on the plateform after 2015. The current usage metrics is available 48-96 hours after online publication and is updated daily on week days.
Initial download of the metrics may take a while.