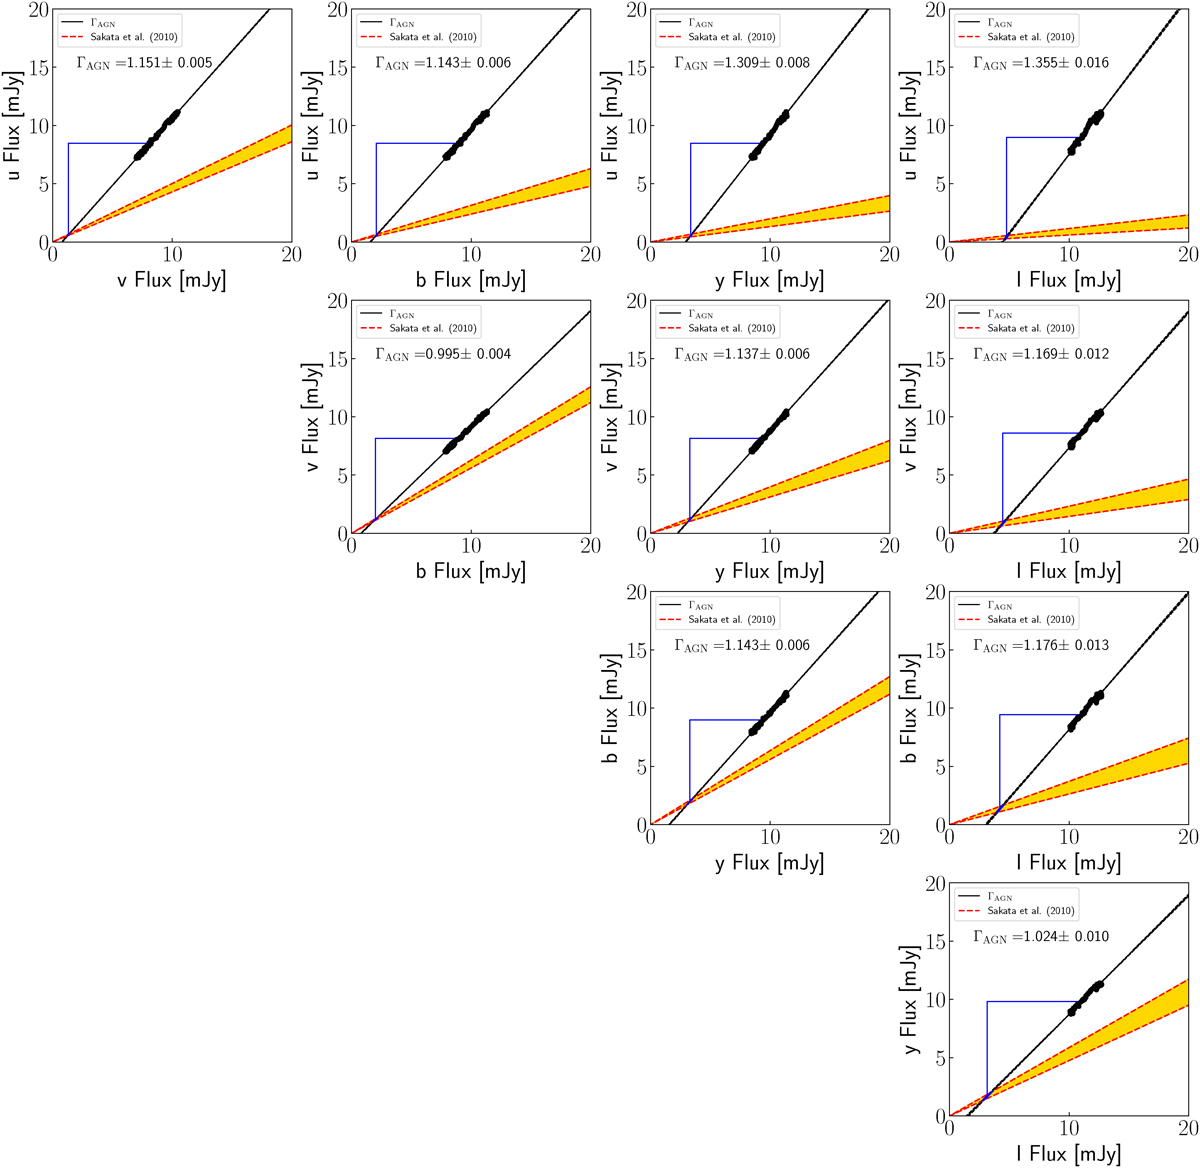
Fig. A.1.
Download original image
Flux variation gradient diagrams for all filter pairs. Black points are the observed fluxes; the OLS-bisector fit (black line) gives the AGN slope ΓAGN (values in each panel). Dashed red lines show the range of host slopes from Sakata et al. (2010) (yellow region); their intersections with ΓAGN yield the host fluxes. Blue lines indicate the corresponding AGN flux ranges.
Current usage metrics show cumulative count of Article Views (full-text article views including HTML views, PDF and ePub downloads, according to the available data) and Abstracts Views on Vision4Press platform.
Data correspond to usage on the plateform after 2015. The current usage metrics is available 48-96 hours after online publication and is updated daily on week days.
Initial download of the metrics may take a while.