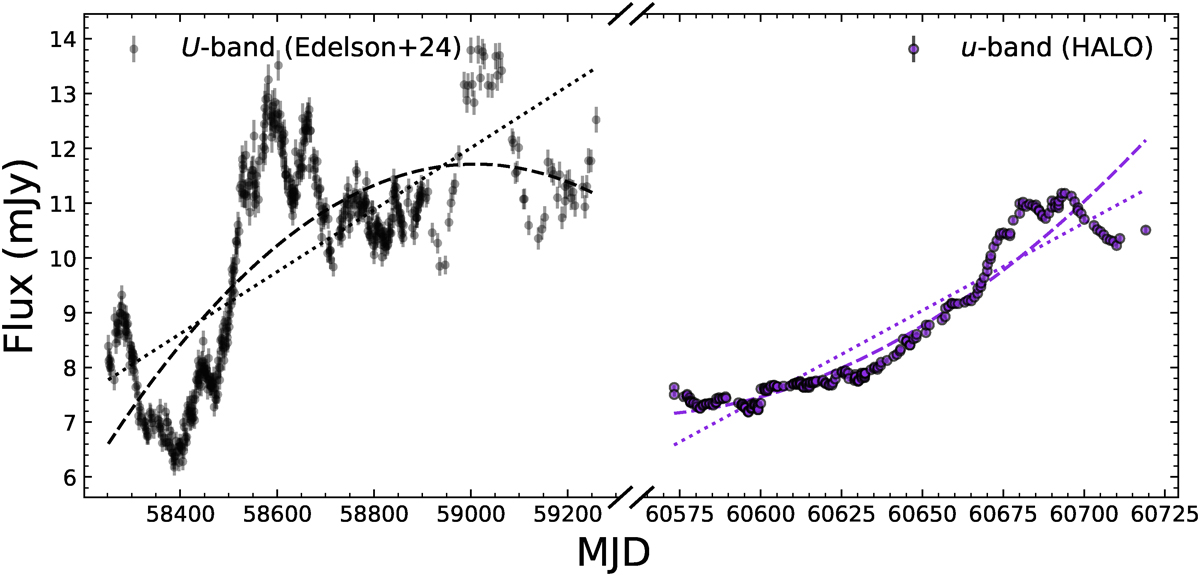
Fig. B.1.
Download original image
Comparison of the light curves of Fairall 9 in the Swift-U band (black points) from Edelson et al. (2024) (MJD 58251.6570−59259.1066) and the OCM-u band (blue-violet points) obtained during our HALO observing campaign (MJD 60573.2523−60719.0495), together with their respective detrending trends. The dotted and dashed lines show the detrending trends with order= 1 and 2, respectively. The Swift-U and OCM-u light curves exhibit distinctly different long-term detrending behaviors across their independent monitoring periods. This suggests that the detrending trend is strongly dependent on the overall duration of the light curve, as different time spans subtract different components of the slower variability from the observed signal.
Current usage metrics show cumulative count of Article Views (full-text article views including HTML views, PDF and ePub downloads, according to the available data) and Abstracts Views on Vision4Press platform.
Data correspond to usage on the plateform after 2015. The current usage metrics is available 48-96 hours after online publication and is updated daily on week days.
Initial download of the metrics may take a while.