Fig. 2.
Download original image
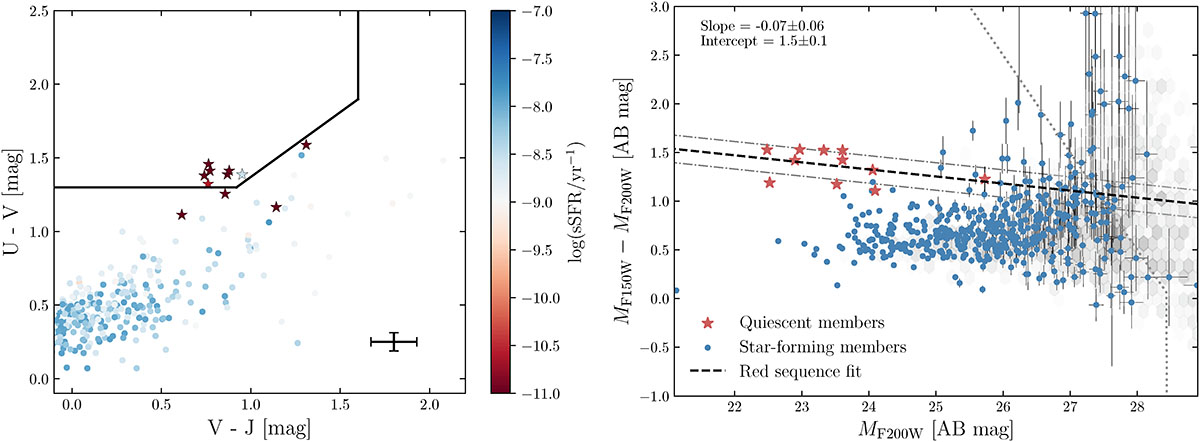
Left: rest-frame UVJ diagram of protocluster members. The colour selection function is shown in black lines. Identified quiescent galaxies are marked with a star. The sSFRs of the galaxies is coded in colour. The cross in the bottom right corner shows the average uncertainty Right: colour-magnitude diagram of quiescent (red stars) and star-forming (blue dots) members. The background hexagons show the density of field galaxies. Overlaid is a linear fit to the quiescent galaxies (black dashed) and the scatter (gray dot-dashed), with the slope and intercept at MF200W = 21 shown in text. The observational depth is shown with a gray dotted line.
Current usage metrics show cumulative count of Article Views (full-text article views including HTML views, PDF and ePub downloads, according to the available data) and Abstracts Views on Vision4Press platform.
Data correspond to usage on the plateform after 2015. The current usage metrics is available 48-96 hours after online publication and is updated daily on week days.
Initial download of the metrics may take a while.