| Issue |
A&A
Volume 706, February 2026
|
|
|---|---|---|
| Article Number | A344 | |
| Number of page(s) | 11 | |
| Section | Extragalactic astronomy | |
| DOI | https://doi.org/10.1051/0004-6361/202557857 | |
| Published online | 19 February 2026 | |
Cosmic Vine: High abundance of massive galaxies and dark matter halos in a forming cluster at z = 3.44
1
Cosmic Dawn Center (DAWN) Copenhagen, Denmark
2
DTU Space, Technical University of Denmark Elektrovej 327 DK-2800 Kgs. Lyngby, Denmark
3
CEA, IRFU, DAp, AIM, Université Paris-Saclay, Université Paris Cité, Sorbonne Paris Cité, CNRS 91191 Gif-sur-Yvette, France
4
Instituto de Física, Pontificia Universidad Católica de Valparaíso Casilla 4059 Valparaíso, Chile
5
Instituto de Física y Astronomía, Universidad de Valparaíso Avda. Gran Bretaña 1111 Valparaíso, Chile
6
Millennium Nucleus for Galaxies (MINGAL), Chile
7
School of Astronomy and Space Science, Nanjing University Nanjing 210093, China
8
Key Laboratory of Modern Astronomy and Astrophysics, Nanjing University, Ministry of Education Nanjing 210093, China
9
Niels Bohr Institute, University of Copenhagen Jagtvej 128 2200 Copenhagen, Denmark
★ Corresponding authors: This email address is being protected from spambots. You need JavaScript enabled to view it.
, This email address is being protected from spambots. You need JavaScript enabled to view it.
Received:
27
October
2025
Accepted:
5
January
2026
Abstract
The Cosmic Vine is a massive protocluster at z = 3.44 in the JWST CEERS field, offering an ideal laboratory for studying the early phases of cluster formation. Using the data from the DAWN JWST Archive, we conducted a comprehensive study on the large-scale structure, stellar mass function (SMF), quiescent members, and dark matter halos in the Cosmic Vine. First, we spectroscopically confirmed 136 galaxies in the Vine at z ≈ 3.44, along with an additional 47 galaxies belonging to a diffuse foreground structure at z ≈ 3.34, which we dubbed the Leaf. We identified four subgroups comprising the Cosmic Vine and two subgroups within the Leaf. Second, we identified 11 quiescent members with log(M*/M⊙) = 9.5 − 11.0, the largest sample of quiescent galaxies in overdense environments at z > 3, which gives an enhanced quiescent galaxy number density ∼1 − 2 × 10⁻⁴ cMpc−3 that is two to three times above the field level at log(M*/M⊙) > 10. Notably, these quiescent members form a tight red sequence on the colour-magnitude diagram, making it one of the earliest red sequences known to date. Third, by constructing the SMFs for both star-forming and quiescent members, we find that both SMFs are top-heavy, with a significantly enhanced quiescent fraction at log(M*/M⊙) > 10.5 compared to field counterparts. The stellar mass–size analysis reveals that star-forming members are more compact at higher masses than their field counterparts. Finally, we estimated a halo mass of log(Mh/M⊙) = 13.2 ± 0.3 for the protocluster core and log(Mh/M⊙) = 11.9 − 12.4 for satellite subgroups. The phase-space analysis indicates that three subgroups are likely infalling to the core. This work reveals a high abundance of massive galaxies and dark matter halos in this forming cluster, demonstrating the accelerated assembly of massive galaxies in massive halos when the Universe was less than 2 billion years old.
Key words: galaxies: clusters: general / galaxies: evolution / galaxies: formation / galaxies: high-redshift / galaxies: clusters: individual: Cosmic Vine
© The Authors 2026
 Open Access article, published by EDP Sciences, under the terms of the Creative Commons Attribution License (https://creativecommons.org/licenses/by/4.0), which permits unrestricted use, distribution, and reproduction in any medium, provided the original work is properly cited.
This article is published in open access under the Subscribe to Open model. This email address is being protected from spambots. You need JavaScript enabled to view it. to support open access publication.
1. Introduction
Clusters of galaxies are the most massive structures in the Universe bound by the immense gravity of a virialised dark matter halo. The galaxy population in local galaxy clusters is dominated by old gigantic ellipticals that have scarce ongoing star formation, which tightly assemble in a ‘red sequence’ in the colour-magnitude space (Kodama et al. 1998; Valentinuzzi et al. 2011; Wetzel et al. 2012). The question of how these massive cluster galaxies formed and when they ceased their star formation remain open questions, for which the key to providing answers lies in probing the progenitors of clusters at early cosmic time. Protoclusters, representing the densest structures in the early Universe with accelerated galaxy formation and evolution, are promising progenitors of local galaxy clusters (Chiang et al. 2013; Overzier 2016). Massive galaxies in protoclusters hold critical clues for the formation of brightest cluster galaxies (BCGs) and massive ellipticals in local clusters, while massive quiescent members are particularly important for studying the emergence of the red sequence and testing the models of galaxy quenching and environmental effects (Strazzullo et al. 2016; Chartab et al. 2020; Kubo et al. 2021; Ito et al. 2023, 2025b; Afanasiev et al. 2023; Sun et al. 2024, 2025; Xu et al. 2025). Cosmological simulations predict that protoclusters form within dense nodes of the filamentary cosmic web at early cosmic times and grow through accretion of cold gas and mergers of galaxies and dark matter halos (Dekel et al. 2009; Mandelker et al. 2020; Schaye et al. 2023; Montenegro-Taborda et al. 2023; Nelson et al. 2024). Observations have revealed the large-scale cosmic web and extreme overdensities of galaxies at high redshift, showing a coherent general picture as seen in simulations. As yet, the models have not yet been thoroughly tested and simulations have been seen with clear shortcomings compared with observations (e.g. Shen et al. 2022; Kimmig et al. 2023; Jin et al. 2024). For example, current simulations often fail to realistically reproduce protoclusters and massive galaxies within them, preventing us from investigating detailed physics of cluster galaxy formation and the environmental effects that shape their evolution (e.g. Granato et al. 2015; Bassini et al. 2020; Jin et al. 2024). Dark matter halos play a fundamental role in structure formation, but assessing their masses and properties is extremely challenging in observations. Therefore, deep observations in high-z protocluster fields and improved halo mass estimates are crucial for unveiling both the bright and dark sides of early cluster formation. To date, massive protoclusters have been discovered at the epoch of cosmic noon (z ∼ 2) up to cosmic dawn (z ∼ 6) using various methods (e.g. Pentericci et al. 2000; Gobat et al. 2011; Capak et al. 2011; Walter et al. 2012; Toshikawa et al. 2016; Wang et al. 2016; Oteo et al. 2018; Miller et al. 2018; Pavesi et al. 2018; McConachie et al. 2022; Zhou et al. 2024; Jin et al. 2024; Sillassen et al. 2024; Shah et al. 2024).
However, due to the limited sensitivity and wavelength coverage of the Hubble Space Telescope (HST) and ground-based facilities, our view of these protoclusters is based on only a small number of galaxies that could be confirmed with spectroscopy, such as Lyα emitters (LAEs), Hα emitters (HAEs; e.g. Shimakawa et al. 2014; Guaita et al. 2020; Ramakrishnan et al. 2023; Brinch et al. 2024; Urbano Stawinski et al. 2024b; Pérez-Martínez et al. 2025), and dusty star-forming galaxies (DSFGs; Daddi et al. 2009; Dannerbauer et al. 2014; Oteo et al. 2018; Miller et al. 2018; Gómez-Guijarro et al. 2019; Harikane et al. 2019; Jin et al. 2021; Sillassen et al. 2022; Alberts & Noble 2022). Without highly complete memberships and deep multi-wavelength observations, it is not feasible to robustly constrain the global properties (e.g. total stellar masses), subtle environmental effects, and dark matter halos. Previous studies have found no significant association between biased tracers (e.g. quasars) and the density field (e.g. Husband et al. 2013; Uchiyama et al. 2018); thus, it is crucial to test this with deeper and more complete samples (e.g. Eilers et al. 2024). JWST has provided a great opportunity to discover protoclusters at high redshift and, in particular, massive structures have been discovered in JWST deep fields with highly complete memberships (e.g. Sun et al. 2024; Jin et al. 2024; Sun et al. 2025).
These discoveries have revealed large-scale structures that span tens of Mpc (Jin et al. 2024; Li et al. 2025). Massive quiescent galaxies have been discovered in dense environments at z > 3 (Kubo et al. 2021; McConachie et al. 2022; Jin et al. 2024; Tanaka et al. 2024; Kakimoto et al. 2024; Ito et al. 2025b; de Graaff et al. 2025b; Umehata et al. 2025) and the red sequence has been revealed at z > 2 (Willis et al. 2020; Ito et al. 2023; Tanaka et al. 2024), enabling the study of potential environmental effects. More recently, top-heavy stellar mass functions (SMFs) have been found in observations of protoclusters at z ≳ 2.5 (Sun et al. 2024, 2025; Galbiati et al. 2025) and in simulations (Chartab et al. 2025), indicating a top-down scenario of cluster galaxy formation. With an increasing number of JWST images and spectra, we find ourselves at an ideal moment to further push these frontiers and unveil the detailed processes that govern the formation and growth of galaxy clusters.
On the one hand, simulations predict that protoclusters consist of a series of dark matter halos of subgroups assembled along the cosmic web. Nevertheless, characterising dark matter halos with observations remains a challenging task because traditional tracers such as diffuse X-ray emission, the Sunyaev-Zel’dovich effect, and gravitational lensing are observationally expensive at high redshift (Clowe et al. 2006; Wang et al. 2016; Gobat et al. 2019; Di Mascolo et al. 2023; Cha et al. 2025; Zhou et al. 2026; Travascio et al. 2025), leaving only stellar to halo mass relations (SHMR) as a practical tool for estimating dark matter masses for high-z samples, although they come with a large uncertainty. Recently, the exploration of SHMR has been pushed towards higher redshift (Shuntov et al. 2022; Paquereau et al. 2025) and stellar mass measurements have been significantly improved with deep multi-wavelength surveys (e.g. Weaver et al. 2022), allowing for better constraints to be set on the halo mass of z ≳ 3 structures. For example, Sillassen et al. (2024) extensively tested several methods of estimating halo masses in a sample of massive groups at 1.5 < z < 4 using data from the Northern Extended Millimeter Array (NOEMA) and the COSMOS2020 catalogue (Weaver et al. 2022), finding that the SHMR-based methods can constrain the halo mass uncertainty down to approximately 0.3 dex at z ∼ 3. With these improved methods and new JWST data, protoclusters in JWST deep fields offer ideal targets to characterise the assembly of massive dark matter halos.
In this paper, we use JWST data to investigate the galaxy population, SMFs, and dark matter halos in the z = 3.44 protocluster Cosmic Vine found by Jin et al. (2024) in the JWST CEERS field. In Sect. 2, we present the observations, the sample selection, and the methodology. Section 3 describes the main results and discusses the implications. We summarise our results and present our conclusions in Sect. 4. We adopted a flat cosmology with Ωm = 0.27, ΩΛ = 0.73, and H0 = 70 km s−1 Mpc−1, and used an initial mass function (IMF) from Chabrier (2003). All reported magnitudes are in the AB system (Oke 1974).
2. Data and methodology
2.1. DJA photometry and spec-z catalogues
For the photometric data throughout the paper, we use JWST and Hubble Space Telescope (HST) data from the publicly available DAWN JWST Archive (DJA; photometry v7.4; spec-z v4.4; Valentino et al. 2023; Brammer & Valentino 2025; de Graaff et al. 2025a; Heintz et al. 2025). For the spectroscopic data, we made use of the DJA spectra compilation v4.4, using only robust (grade = 3) spectra, in addition to the Jin et al. (2024) sample which includes spectra from Keck/MOSFIRE, MOSDEF, Keck/DEIMOS, and DEEP3 (Schreiber et al. 2018; Kriek et al. 2015; Urbano Stawinski et al. 2024a; Cooper et al. 2012), which includes new NIRSpec data from the following JWST programs; AEGIS (PID #1213, PI: Luetzgendorf), CEERS (PID #1345, PI: Finkelstein; PID #2565, PI: Glazebrook; PID #2750, PI: Arrabal-Haro; PID #4106, PI: Nelson; PID #4287, PI: Mason), RUBIES (PID #4233, PI: de Graaff), CAPERS (PID #6368, PI: Dickinson), and DeepDive (PID #3567, PI: Valentino; Finkelstein et al. 2025; Arrabal Haro et al. 2023; de Graaff et al. 2025a; Ito et al. 2025a). Imaging data from the DJA used in this work includes data from CEERS (Finkelstein et al. 2025) and CANDELS (Grogin et al. 2011; Koekemoer et al. 2011). We estimated the depth of the observations using several methods (Appendix A), the imaging data includes the following passbands; HST/F435W; F606W; F814W; F105W; F125W; F140W; F160W and JWST/F115W; F150W; F182M; F200W; F210M; F277W; F356W; F410M; and F444W. A detailed description of DJA data reduction, calibration, and source extraction is presented in Valentino et al. (2023). In short, we retrieved the level-2 products from the Mikulski Archive for Space Telescopes (MAST) and processed them with the Grizli pipeline (Brammer & Matharu 2021; Brammer et al. 2022). Images are aligned to Gaia DR3 (Gaia Collaboration 2021), co-added, and drizzed (Fruchter & Hook 2002) to a final pixel scale of 0.04″. Sources are extracted using SEP (Barbary 2016) in circular apertures with a diameter of 0.7″, corrected within an elliptical Kron aperture (Kron 1980), with photometric errors measured in empty apertures. The extraction is performed on combined long wavelength JWST images (F277W+F356W+F444W). The extracted photometry was fit with EAZY-PY to estimate photometric redshifts in the interval z = 0 − 18, using 13 templates from the Flexible Stellar Populations Synthesis code (FSPS Conroy & Gunn 2010), described in Kokorev et al. (2022) and Gould et al. (2023). We adopted the 50th percentile of the redshift probability density function (PDF(z)) as the photometric redshift. The spectroscopic data are a mix of low resolution (R ∼ 100) NIRSpec Prism and medium resolution (R ∼ 1000) NIRSpec GRISM, utilising the gratings; G235M and G395M, and were reduced with the MsaExp pipeline (Brammer 2023). 1D spectra are fit using MsaExp, and the redshifts were determined using either Balmer absorption lines or emission lines including λλ[O III]4959,5007, Hα, Hβ, Paε, Paδ, and Paγ.
To determine the completeness of the DJA CEERS catalogue, following the method presented in Paquereau et al. (2025), we used the F444W photometry and fit a power law to the observed magnitudes and determined where the observed magnitudes deviate from the power law by 20 percent, as shown in Fig. B.1. We estimate the 80% completeness of the F444W observations in the CEERS redshift selected field catalogue to be 28.8 AB mag, while the 80% completeness in F444W is 27.1 mag for the Cosmic Vine members. It is assumed the catalogues are 100% complete at magnitude brighter than 28.5 mag and 26.8 mag, respectively (Fig. B.1).
The accuracy of the photometric redshifts are determined by calculating the normalised median absolute deviation (σNMAD, Eq. (3) in Weaver et al. 2022). The fraction of outliers, η, is defined as η = |Δz|> 0.15(1 + zspec), and the bias is defined as b = median(Δz). We show the zphot − zspec comparison in Fig. C.2, where we find σNMAD = 0.017, η = 5.32%, and b = 0.001.
2.2. Membership and completeness
Using the CEERS catalogue from the DJA, we identify photometric candidate members by selecting galaxies with the 16th and 84th percentile zphot within z = 3.44 ± 0.25, (i.e zphot, 16th > 3.19 and zphot, 84th < 3.69). This selection was chosen to cover both peaks in the spec-z distribution of CEERS (Fig. C.1), while accounting for photo-z uncertainty (Sect. 2.1, Fig. C.2).
Spectroscopic members were selected as galaxies with 3.3 < zspec < 3.5, encompassing the two identified peaks in the spec-z distribution of CEERS (Fig. C.1). The redshift distribution of spectroscopically confirmed members of the Vine and the Leaf can be seen in Fig. C.1.
By enforcing the 16th and 84th percentile of the photometric redshift probability density function (PDF(z)) of each galaxy to be in a small threshold, we were able to limit the number of expected interlopers; however, we also ended up introducing a bias toward brighter galaxies. This bias can be seen in Fig. B.1, where the 80% completeness level of members is 1.7 mag brighter than the field. To estimate the mass completeness, we followed the method from Pozzetti et al. (2010). In short, we selected the 30% faintest galaxies above the completeness limit and rescaled their masses as if they were detected at the completeness limit following Eq. (1).
 (1)
(1)
Then, we defined the mass completeness limit as the 95th percentile of the Mmlim distribution. This yields stellar mass completeness limits of M* > 108.32 M⊙ for the field and M* > 108.61 M⊙ for the Vine members.
We found 183 spec-z confirmed galaxies and 314 photo-z candidate members. Based on these newly identified members, we updated the galaxy overdensity using the weighted adaptive kernel (WAK) mapping code from Brinch et al. (2023). In short, WAK iteratively computes the galaxy surface density field taking photometric redshift uncertainty into account in fixed kernels at the positions of the galaxies, over a grid search of kernel widths from 0.0001 to 0.1 deg. In this work, the optimal global kernel width is 18.5″ (140.7 pkpc). The updated overdensity contours are shown in Fig. 1. We note that given the uncertainty of photometric redshifts (Fig. C.2), it is impossible to distinguish if photo-z candidate members belong to the Vine or the Leaf, so we treated all candidate members as members of the whole structure.
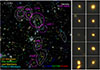 |
Fig. 1. Left: colour image of the densest region of the Vine and the Leaf. Colours correspond to JWST/F150W, F277W, and F444W as the blue, green, and red channels respectively. The projected density is shown as white contours at 2, 3, and 4σ levels. The virial radii of the six most massive identified dark matter halos are marked with magenta dashed circles. Quiescent members of the Cosmic vine are marked with orange circles, spectroscopically confirmed members of the Cosmic Vine are marked with green circles, spec-z confirmed members of the Leaf are marked with yellow circles, and candidate members with cyan circles. Right: NIRCam/F150W, F277W, and F444W colour images of 11 quiescent galaxies in the Cosmic Vine. The field of view of each cutout is 2″. |
2.3. Bagpipes SED fitting
Using a similar setup as described in Jin et al. (2024), we fit the DJA JWST+HST photometry using Bagpipes (Carnall et al. 2018). For spectroscopically confirmed members, we fixed the redshift of the fit, while for candidate members, we let the redshift vary between 3 < zphot < 4, finding overall consistent photometric redshifts as EAZY. Specifically, we used a double-power-law star formation history, allowing for stellar metallicities in the range −2.3 < log(Z/Z⊙) < 0.7, with a log-uniform prior; an age of the Universe at star formation history turnover in the range 0.1 Gyr < τ < 15 Gyr and shape parameters with log-uniform priors in the ranges −2 < log α < 4 and −2 < log β < 4; a dust attenuation law from Salim et al. (2018), with attenuation in the range 0 < AV < 4; deviation from a Calzetti et al. (2000) curve in the range −0.3 < δ < 0.3, with a Gaussian prior μδ = 0 and σδ = 0.05; a 2175 Å bump strength in the range 0 < B < 5 and an extra attenuation of stars in birth clouds in the range 1 < η < 5, along with nebular emission (precomputed with CLOUDY Ferland et al. 2017) with radiation fields in the range −4 < log(U) < − 2; and gas-phase metallicities in the range −2.3 < log(Zneb/Z⊙) < 0.7 with a log-uniform prior. All priors are uniform, unless otherwise specified.
2.4. Quiescent galaxy selection
We classified quiescent galaxies as galaxies that either fulfil the rest-frame UVJ colour criteria from Williams et al. (2009, as detailed in our Fig. 2 (left)) or that have an 84th percentile posterior specific star formation rate (sSFR = SFR/M*) of log(sSFR84th/yr−1) < − 10.3 (∼1.8 dex below the star-forming main sequence at z = 3.44, Schreiber et al. 2015). The adopted sSFR limit is conservative, compared to the criterion of Carnall et al. (2023b), (log(sSFR/yr−1) < 0.2/tH, where tH is the age of the Universe at z = 3.44), which would be log(sSFR50th/yr−1) < − 10.0 at the redshift of the Cosmic Vine. We present the results in Sect. 3.2. We note that while the completeness limit of quiescent galaxies is likely fainter than the SFG completeness limit (e.g. Weaver et al. 2022), the faintest QG member is 2 mag brighter than the SFG completeness limit in F444W. Furthermore, the least massive QG is 1 dex more massive than the SFG stellar mass completeness limit, where the difference in COSMOS2020 is at most 0.5 dex (Weaver et al. 2022).
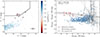 |
Fig. 2. Left: rest-frame UVJ diagram of protocluster members. The colour selection function is shown in black lines. Identified quiescent galaxies are marked with a star. The sSFRs of the galaxies is coded in colour. The cross in the bottom right corner shows the average uncertainty Right: colour-magnitude diagram of quiescent (red stars) and star-forming (blue dots) members. The background hexagons show the density of field galaxies. Overlaid is a linear fit to the quiescent galaxies (black dashed) and the scatter (gray dot-dashed), with the slope and intercept at MF200W = 21 shown in text. The observational depth is shown with a gray dotted line. |
2.5. Dark matter halo mass estimates
To estimate the dark matter halo masses, we followed the methods presented in Sillassen et al. (2024). In short, we found halos using the 2D density contours (Fig. 1) as initial guesses of halo centres. Given that the overdensity contours are only calculated with the 2D distribution of galaxies without weighting stellar mass, we thus complement the halo finding by adding the locations of massive galaxies in relatively low overdensity, such as Halo 3 and Leaf 2. We obtained an initial halo mass by scaling the most massive galaxy within a 15″ circle (i.e. the virial radius of a log(Mh/M⊙) = 12.7 halo at z = 3.44, the progenitor of a Virgo-like cluster, see Chiang et al. 2013) with the stellar to halo mass relation (SHMR) from Behroozi et al. (2013, Mh(1)1). Using the recovered initial halo mass, we infer a virial radius using the relation from Goerdt et al. (2010), and find a new halo centre by calculating the stellar mass weighted centre of mass of the galaxies within the new virial radius. With the updated centres, we calculated the total stellar mass, accounting for background contamination and stellar mass completeness (e.g. Daddi et al. 2021, 2022). We then scaled the total stellar mass with SHMRs from Shuntov et al. (2022, Mh(2a)) and van der Burg et al. (2014, Mh(2b)). Other than using stellar masses, we estimated the overdensity of each halo and use this overdensity to estimate the halo mass (Mh(3)). We did this iteratively, until the halo mass and halo members converge. The halo masses of the four methods are overall consistent; thus, we adopted an average of the four as the best estimate of halo mass.
Furthermore, we estimated halo mass of the core using the velocity dispersion of member galaxies in two ways, for both methods, we defined the core members as galaxies within the expected virial radius and 3σv of a log(Mh/M⊙)∼13 halo at z = 3.438 for which we: (1) measured the standard deviation of redshift by fitting the redshift distribution of the core galaxies with a Gaussian, converted to a velocity dispersion with σv = cσz/(1 + z); and (2) following Bayliss et al. (2014), we calculated the square root of the bi-weight variance of the galaxy proper velocities (vi = c(zi − z)/(1 + z)) using jackknife sampling.
3. Results and discussion
3.1. Large-scale structure and subgroups
With a total of 183 spectroscopic redshifts and 314 photo-z members, we confirm the large-scale structure reported by Jin et al. (2024). The new spec-zs significantly improve the membership completeness, enabling us to identify several sub-structures in the Vine. As shown in the spec-z histogram in Fig. C.1, we find two major peaks at z = 3.44 and z = 3.34, of which the z = 3.44 peak traces the main structure of the Vine. The z = 3.34 peak reveals a foreground structure that is obviously more diffuse than the Vine, which we dubbed the Leaf. The new data confirm the massive and overdense nature of the Vine, while the Leaf is dominated by low-mass galaxies and consists of two substructures. The spec-z confirmed members of the Vine span an area of 8.2 pMpc × 3.6 pMpc.
As traced by the galaxy overdensities in Fig. 1, we identified four subgroups in the Vine. In the core, four more galaxies were spectroscopically confirmed in addition to the sample from Jin et al. (2024). The other subgroups also host massive galaxies (log(M*/M⊙) > 10), with two to ten spectroscopically confirmed members in each subgroup.
In addition to spec-z members, we selected 314 photo-z members with 3.19 < zphot < 3.69. Together, we have 497 confirmed and candidate members that extend over the entire CEERS field, corresponding to 13.1 pMpc × 4.1 pMpc. We note that the true size of the large-scale structure is likely extending further than the field of view (FoV) of the CEERS field, additional data are needed to verify if this is the case.
3.2. Quiescent galaxies and red sequence
Using the UVJ and sSFR criteria in Sect. 2.4, we selected 11 quiescent galaxies (Fig. 1 right), in which 10 are within the Vine (5 spec-z confirmed) and 1 spec-z confirmed within the Leaf (the identified quiescent galaxies are shown in Fig. 2 and Table 1); of these QGs, 7 were selected with both the UVJ and sSFR criteria and 4 were selected using only the sSFR criterion (Fig. 2 and Table 1). We note that all sources selected only with sSFR were confirmed to be quiescent with JWST spectra. As works in the literature have demonstrated that the traditional UVJ selection might miss some quiescent galaxies (e.g. Baker et al. 2025a), we also used the expanded UVJ selection criterion Eq. (3) in Baker et al. (2025a) as a test. As a result, we found 10 of the 11 QGs are aptly selected. The only missing one can be selected with sSFR and has been spectroscopically confirmed as a QG by Jin et al. (2024). Two of the QGs are a merging pair already identified by Jin et al. (2024) and spectroscopically confirmed by Ito et al. (2025b), which are the central galaxies in the most massive core. The remaining sources were also identified as QGs by literature studies (Merlin et al. 2019; Shahidi et al. 2020; Carnall et al. 2023a; Valentino et al. 2023; Long et al. 2024). Three QGs are located in the two dense subgroups just north-east of the core, while the six other identified QGs lie outside of the densest regions of the Vine.
Physical properties of quiescent members.
We highlight that this is the largest sample of quiescent galaxies ever detected in a z > 3 dense environment, as literature studies have only identified 1–7 QGs per structure at z > 3 (Kubo et al. 2021; McConachie et al. 2022; Tanaka et al. 2024; Kakimoto et al. 2024; de Graaff et al. 2025b; Baker et al. 2026). This large number of quiescent galaxies in a z > 3 protocluster appears significantly higher than the field level. Thus, we constrained the number density of quiescent galaxies in the Vine, first adopting a sky area of 8.2 × 3.6 Mpc2 in physical scale (as reported in Sect. 3.1) and a redshift range of 3.4 < z < 3.5, which corresponds to a co-moving volume of 4.86 × 10⁴ cMpc3. We estimated the QG number density of the Vine with three different assumptions: (1) all nine QG candidates with log(M*/M⊙) > 10 are a part of the Vine; (2) inspired by the work of Long et al. (2024), we performed 104 simulations with MCMC sampling, assuming Gaussian photo-z uncertainties, adopting the inner 68th percentile of the posterior number density distribution and accounting for Poissonian noise; and (3) for the five photo-z selected QGs, we assumed their chance of being within the Vine (46%) is consistent to the ratio between spec-z members within the Vine and all photo-z selected candidate members with a spec-z.
We find (1) yields a number density of 1.85 × 10⁻⁴ cMpc−3 (NQG = 9); (2) yields  (
( ); and (3) gives 1.3 × 10⁻⁴ cMpc−3 (
 ). Taking into account all three estimates, we obtain a number density in the range of 1.02 − 1.85 × 10⁻⁴ cMpc−3. This number density is 1.5 − 2.8 times higher than the field density 6.57 ± 1.03 × 10⁻⁵ cMpc−3 reported by Baker et al. (2025b) at 3.0 < z < 3.5 and log(M*/M⊙) > 10, indicating an elevated abundance of quiescent galaxies in dense environment, which is further highlighted by the enhanced quiescent fraction compared with the field (see Sect. 3.3). This elevated abundance of quiescent galaxies in the Cosmic Vine is likely the origin of the high abundance of quiescent galaxies at 3 < z < 4 in the CEERS field reported by Carnall et al. (2023b), which was attributed to cosmic variance by Valentino et al. (2023).
With a sample of 11 quiescent galaxies, we investigated whether the ubiquitous red sequence of local galaxy clusters is already present in this early large-scale structure. To do so, we created a colour-magnitude diagram using NIRCam F150W/F200W colour, where the two bands respectively cover blue- and red-wards of the Balmer and Dn4000 break at z = 3.44. In Fig. 2 (right), we fit the colour-magnitude of quiescent members with a linear relation normalising at MF200W = 21, resulting in a negative slope −0.07 ± 0.06 and an intercept of 1.5 ± 0.1. This red sequence is in agreement with the observed red sequence intercept (1.41) and slope (−0.013) of the z = 1.98 cluster XLSSC122 (Willis et al. 2020).
This red sequence is one of the two earliest known to date: the other one is at z ∼ 4 reported by Tanaka et al. (2024), which exhibits a red sequence in H − K vs. K diagram but is more scattered than the Vine’s. We note that the structure reported by Tanaka et al. (2024) is more diffuse and less complete in terms of spectroscopically confirmed members than the Vine.
The early emergence of a red sequence and the high abundance of quiescent galaxies suggest that the Cosmic Vine is in an early stage of forming typical cluster galaxies such as those ones in the Local Universe. As is evident from the multiple subgroups, it demonstrates that the red sequence arises before the subgroups coalesce and the structure virialises. Intriguingly, only two massive quiescent members are in the core and the majority of them are located outside of the densest regions. These massive quiescent galaxies outside the dense core might have experienced pre-processing in subgroups, such as the Cosmic Rose (Alberts et al. 2024), which have since coalesced into single massive galaxies (e.g. Jin et al. 2023). This pre-processing could be a substantial environmental effect on the formation and overabundance of massive galaxies in the Cosmic Vine. However, as high pressure hot gas is unlikely to be present in such a large elongated structure, it disfavours the dominance of environmental quenching mechanisms (Alberts & Noble 2022) that require hot gas and virialisation, such as ram pressure stripping (RPS). Instead, these massive galaxies are likely dominated by mass quenching mechanisms, such as AGNs and compact starbursts (Jin et al. 2024; Wang et al. 2024), indicating that they share similar quenching pathways with massive field quiescent galaxies (Carnall et al. 2023b; Ito et al. 2025b; Valentino et al. 2025).
3.3. Stellar mass function and quiescent fraction
To further characterise the assembly of the galaxy population in the Vine, we establish the SMFs of star-forming galaxies (SFGs) and QGs separately and fit them with the Schechter function (Schechter 1976, Eq. (2)). We used a Markov chain Monte Carlo (MCMC) fitting procedure for both members and the rest of the CEERS field. We selected a sample of 2863 field galaxies in CEERS as a control sample, defined as galaxies with 3 < zphot < 4 that have not been selected as candidate members of the Vine. The SMFs are constructed as
 (2)
(2)
We calculated the observed Φd(log M), following the 1/Vmax method described in Schmidt (1968) and Weigel et al. (2016). In short, for each galaxy in each mass-bin we estimate the maximum volume in which a galaxy at the given mass and redshift could be detected; Vmax, i. The Vmax, i for each galaxy was calculated with the expression
 (3)
(3)
where Ωsurvey is the sky coverage of the survey (105.2 arcmin2), and Ωsky = 41253 deg2 is the total area of the sky, dc(z) is the co-moving distance to redshift z, zmin is the lower edge of the redshift bin, and zmax, i is the minimum value of the upper edge of the redshift bin and the maximum redshift at which a galaxy at this mass could be detected; zmax, i = min(zmax, bin, zmax, galaxy). The number density in each mass bin is then weighted by the JWST/F444W completeness of each galaxy and Vmax, i,
 (4)
(4)
The SMF of the Vine is normalised to the field SMF, based on the number of galaxies in each sample.
The measured and Schechter-fitted SMFs of the Cosmic Vine and CEERS field are shown in Fig. 3-left, and the shape parameters of the fitted SMFs are shown in Table 2, we note that only data points above the stellar mass completeness limit are considered in the fitting procedure. If the galaxies belonging to the Leaf are excluded from the SMF fit, the parameters do not change significantly ( ). The fitted M* is not significantly different between the CEERS field and Cosmic Vine members; however, α is significantly higher in the Cosmic Vine compared with the field, indicating an enhancement of high-mass (M* > 1010 M⊙) star-forming galaxies. If we do not remove members of the Vine and fit the field SMF, we find
  and
and  , leading to the same conclusion. Comparing to the literature results, the shape of the Vine SMF is similar to the top-heavy SMFs of the z = 2.51 CL J1001 cluster in the COSMOS field (Sun et al. 2024) and the z = 3.98 Bigfoot (Sun et al. 2025), which both show a high abundance of SFGs with M* = 1010.5 − 11 M⊙.
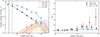 |
Fig. 3. Stellar mass functions (SMFs) and quiescent fractions. Left: SMFs for the star-forming (light blue) and quiescent (red) members of the Vine, fitted with a Schechter function. The black dots and line show the CEERS SFG field sample, and the orange dots and line show the CEERS QG sample. The vertical lines mark the stellar mass completeness limit of the field (black) and Cosmic Vine members (blue). Right: quiescent fractions of Cosmic Vine members (red) and the rest of the CEERS field (black). Blue dots with error bars represent the quiescent fractions from the JWST/PRIMER fields at z ∼ 3.45 (Yang et al. 2025). |
Best-fit SMF parameters.
To investigate the environmental dependence of quenching galaxies, we measured the quiescent fraction fQG = NQG/(NQG + NSFG) in both the Vine and the rest of the CEERS field. As shown in Fig. 3 (right), the Vine exhibits an increasing fQG at high stellar mass log(M*/M⊙) > 10.5, compared with the rest of the field.
Notably, at the most massive stellar bin log(M*/M⊙)∼10.8, the quiescent fraction of the field level is very low fQG < 0.09, while in the Vine this mass bin is dominated by the two central merging quiescent galaxies (Ito et al. 2025b) with fQG = 50 ± 30%. This again demonstrates the massive members of the Cosmic Vine are more evolved than field counterparts. An enhanced quiescent fraction was reported by McConachie et al. (2022) in the z = 3.37 MAGAZ3NE J0959 protocluster, which shows similar results as in this work.
3.4. Stellar mass–size relation
To investigate whether there is a difference in the sizes of Cosmic Vine members and the rest of the field, we established the mass–size relation of star-forming and quiescent members using the morphology catalogue from the DJA (Genin et al. 2025), where the size of each galaxy is fitted assuming identical radii across all JWST bands. We fit the mass–size relation to the functional form, with the results shown in Fig. 4, following
 (5)
(5)
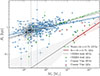 |
Fig. 4. Mass–size relation of star-forming members (blue), quiescent members (red), field SFGs (black), and field QGs (green). Power-law fits to SFG members and field SFGs are shown with blue solid and black dotted lines respectively, with the fit uncertainty of SFG members shown as shaded region. Mass–size relations of late type galaxies from Ward et al. (2024, green line) and quiescent galaxies from Ito et al. (2024, red line) are overplotted, the relations are extrapolated for SFGs with M* < 109.5 M⊙ and QGs with M* < 1010.3 M⊙. The vertical dashed lines show the mass completeness limit of the CEERS field (gray) and Cosmic Vine (blue). |
where A is the effective radius at M* = 5 × 10¹⁰ M⊙ in kpc.
As shown in Fig. 4, SFGs in the CEERS field follow well the mass–size relation of z ∼ 3.75 late-type galaxies from Ward et al. (2024), while Cosmic Vine members display a slightly shallower slope. This results in a radius of 0.09 (∼2σ) to 0.15 (∼3σ) dex lower in star-forming Vine members with mass log(M*/M⊙) = 10.7 when compared to the rest of the field and the relation from Ward et al. (2024) respectively (Fig. 4). This indicates that massive star-forming Vine members are in general more compact than field SFGs at the same redshift. The majority of the massive SFGs show a bulge-like core with a star-forming disk and high bulge-to-total ratios B/T > 0.5, indicating that their compact sizes are likely due to rapid growth of bulges (e.g. Huertas-Company et al. 2025; Shuntov et al. 2025). Overall, QG members follow the mass–size relation of z ∼ 3.75 QGs from Ito et al. (2024) with large scatter. However, the sample size of QGs remains too small to draw any conclusion on the size difference of QG members.
3.5. Dark matter halos and phase-space analysis
Using the methods described in Sect. 2.5, we estimated the dark matter halo mass of the six subgroups, with the best halo mass estimates presented in Table 3. As an alternative approach, we also measured the velocity dispersion of spec-z members in the core halo and derived its halo mass using Eq. (1) of Wang et al. (2016). We obtained (1): σv = 432 ± 174 km/s and (2): σv = 427 ± 184, corresponding to halo masses of log(Mh/M⊙) = 13.3 ± 0.5 and log(Mh/M⊙) = 13.3 ± 0.6. This halo mass is in agreement with the average of the four other methods (Table 3). The large uncertainty on the velocity dispersion, and thereby halo mass, arises from the low statistic of spec-z confirmed galaxies in the core.
Centres, masses, and central redshift of identified halos.
The large number of spec-z confirmed members across the entire structure allow us to create a phase-space diagram and assess whether the members and subgroups are gravitationally bound. To construct the phase-space diagram, we first measured the projected radii from the centre of the most massive core to the spec-z confirmed galaxies in physical kpc. Then we measured the velocity difference between to the redshift of central galaxies (Table 3), and the galaxies with Δvi = c(zi − zhalo)/(1 + zhalo). The velocity differences are multiplied by  to correct the measured projected velocities to 3D velocities (Rhee et al. 2017) assuming velocity isotropy. Finally, we calculate the escape velocity as a function of distance from the central halo, using a Navarro–Frenk–White (Navarro et al. 1996) density profile as described in Rhee et al. (2017), shown in Eq. (6), where chalo is the concentration parameter of the dark matter halo. We estimated the chalo using the relation from Ludlow et al. (2016), expressed as
 (6)
(6)
As shown in the phase-space diagram in Fig. 5 (left), the members of the core are gravitationally bound to the most massive dark matter halo. Interestingly, we also found several massive galaxies with the same redshift as the core out to a projected radius of Rproj ∼ 3 pMpc. This projected radius corresponds to a radius of ∼15 cMpc, aligning with the expected effective radius of a Coma-like cluster progenitor at z ∼ 3.5 (Chiang et al. 2013). The most massive halo mass estimated at log(Mh/M⊙) = 13.2 ± 0.3 is also consistent with the expectation of a Coma-like progenitor at z ∼ 3.5. Together with the size and mass of the Cosmic Vine, all evidence suggests it will evolve to a massive galaxy cluster with log(Mh/M⊙) > 15 at redshift z ∼ 0. Furthermore, we show the centres of each of the identified subgroups in Fig. 5 (right). Two subgroups are enveloped within the escape velocity curves, while the third subgroup (Halo 4) is just above the velocity curve. This could indicate that the three subgroups are infalling clumps, which will eventually merge with the core. We note that massive galaxies not bound to the core are a part of the filamentary large structure that connects the core and subgroups of the Cosmic Vine.
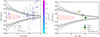 |
Fig. 5. Phase-space diagrams for spectroscopically confirmed members and subgroups. Left: galaxies are sized and coloured according to the stellar mass. Measured velocity differences are multiplied with a factor of |

We also note that the 3D separation between the core of the Cosmic Vine and the Leaf is ∼87.4 cMpc. While this distance is larger than the expected extent of a single forming galaxy cluster at z ∼ 3.5 (Muldrew et al. 2015; Chiang et al. 2017), it is well within the expected size of a filamentary structure of galaxy protoclusters similar to the Hyperion super-protocluster (Cucciati et al. 2018; Ata et al. 2022).
4. Conclusions
The Cosmic Vine is one of the richest structures discovered at z > 3 to date. In this work, we further revealed the large structure and studied the member galaxy populations and the dark matter halos. We have drawn the following conclusions:
-
Using JWST archival data, we spectroscopically confirmed 136 members in the Cosmic Vine at z ≈ 3.44, and 47 members in a newly discovered foreground structure at z ≈ 3.34, which we dubbed the Leaf. In total, we identified 314 candidate, and 183 confirmed members belonging to the whole structure, covering an area of 8.2 × 3.6 Mpc2. We revealed six subgroups with halo mass log(Mh/M⊙)≳12, in which four of them are within the Vine and the remaining two subgroups belongs to the Leaf.
-
Using both UVJ and sSFR, we identified 11 quiescent members with log(M*/M⊙) = 9.5 − 11.0 in the whole structure, constituting the largest sample of quiescent galaxies in overdense environments at z > 3 to date. This large number of quiescent galaxies in a dense structure infers a high number density of quiescent galaxies ∼1 − 2 × 10⁻⁴ cMpc−3 that is two to three times above the field level at log(M*/M⊙) > 10 (Baker et al. 2025b), demonstrating accelerated galaxy evolution in dense environment.
-
Remarkably, the quiescent galaxies form a tight red sequence on the colour-magnitude diagram, significantly elevated from the star-forming members and the field galaxies. It is distinguished as one of the earliest red sequences known to date.
-
We find robust top-heavy SMFs for both star-forming and quiescent members of the Vine compared to the field counterparts, while the quiescent fraction is significantly elevated at high stellar mass log(M*/M⊙) > 10.5.
-
Our stellar mass–size analysis shows that star-forming members are more compact than the field counterparts at higher stellar masses, which is consistent with the predictions from simulations (e.g., Sommer-Larsen & Toft 2010).
-
The halo mass of the most massive subgroup, identified as the core of the structure in Jin et al. (2024), is estimated to be log(Mh/M⊙) = 13.2 ± 0.3. For the other five subgroups, we estimated halo masses in the range log(Mh/M⊙) = 11.9 − 12.4.
-
The phase-space analysis of the structure reveals that several massive galaxies are gravitationally bound to the core, while members out to a distance of R ∼ 3 pMpc have the same redshift as the core, consistent with the effective radius of coma-like cluster progenitors in simulations. Furthermore, the three identified subgroups of the Vine are possibly infalling clumps, supporting the scenario that these halos are merging and on the way to forming a massive cluster.
Coupling the evolved galactic population with the estimated mass and extent of the structure, the Cosmic Vine is likely evolving to a massive galaxy cluster with log(Mh/M⊙) > 15 at z ∼ 0. It already appears to be in an early stage of maturing, prior to coalescing into a single dark matter halo. With the wealth of data already available in CEERS and more incoming, the Cosmic Vine will be an ideal laboratory to study different aspects of cluster formation and galaxy evolution in the future.
Acknowledgments
We thank the anonymous referee for their constructive feedback. The Cosmic Dawn Center (DAWN) is funded by the Danish National Research Foundation under grant DNRF140. SJ acknowledges financial support from the European Union’s Horizon Europe research and innovation program under the Marie Skłodowska-Curie grant No. 101060888. GEM and SJ acknowledge the Villum Fonden research grants 37440 and 13160. FV and KI acknowledge support from the Independent Research Fund Denmark (DFF) under grant 3120-00043B. This work is based on observations made with the NASA/ESA/CSA James Webb Space Telescope. The data were obtained from the Mikulski Archive for Space Telescopes at the Space Telescope Science Institute, which is operated by the Association of Universities for Research in Astronomy, Inc., under NASA contract NAS 5-03127 for JWST. The specific observations analyzed can be accessed via 10.17909/0bq4-kj71. These observations are associated with programs GTO #1213; ERS #1345; GO #2565; DD #2750; GO #3567; GO #4106; GO #4233; GO #4287; and GO #6368. The authors acknowledge the teams and PIs for developing their observing program with a zero-exclusive-access period.
References
- Afanasiev, A. V., Mei, S., Fu, H., et al. 2023, A&A, 670, A95 [NASA ADS] [CrossRef] [EDP Sciences] [Google Scholar]
- Alberts, S., & Noble, A. 2022, Universe, 8, 554 [Google Scholar]
- Alberts, S., Williams, C. C., Helton, J. M., et al. 2024, ApJ, 975, 85 [Google Scholar]
- Arrabal Haro, P., Dickinson, M., Finkelstein, S. L., et al. 2023, ApJ, 951, L22 [NASA ADS] [CrossRef] [Google Scholar]
- Ata, M., Lee, K.-G., Vecchia, C. D., et al. 2022, Nat. Astron., 6, 857 [NASA ADS] [CrossRef] [Google Scholar]
- Baker, W. M., Lim, S., D’Eugenio, F., et al. 2025a, MNRAS, 539, 557 [Google Scholar]
- Baker, W. M., Valentino, F., Lagos, C. D. P., et al. 2025b, A&A, 702, A270 [NASA ADS] [CrossRef] [EDP Sciences] [Google Scholar]
- Baker, W. M., Ito, K., Valentino, F., et al. 2026, A&A, 706, A91 [NASA ADS] [CrossRef] [EDP Sciences] [Google Scholar]
- Barbary, K. 2016, J. Open Source Softw., 1, 58 [Google Scholar]
- Bassini, L., Rasia, E., Borgani, S., et al. 2020, A&A, 642, A37 [NASA ADS] [CrossRef] [EDP Sciences] [Google Scholar]
- Bayliss, M. B., Ashby, M. L. N., Ruel, J., et al. 2014, ApJ, 794, 12 [Google Scholar]
- Behroozi, P. S., Wechsler, R. H., & Conroy, C. 2013, ApJ, 770, 57 [NASA ADS] [CrossRef] [Google Scholar]
- Brammer, G. 2023, https://doi.org/10.5281/zenodo.8319596 [Google Scholar]
- Brammer, G., & Matharu, J. 2021, https://doi.org/10.5281/zenodo.5012699 [Google Scholar]
- Brammer, G., Strait, V., Matharu, J., & Momcheva, I. 2022, https://doi.org/10.5281/zenodo.1146904 [Google Scholar]
- Brammer, G., & Valentino, F. 2025, https://doi.org/10.5281/zenodo.15472354 [Google Scholar]
- Brinch, M., Greve, T. R., Weaver, J. R., et al. 2023, ApJ, 943, 153 [NASA ADS] [CrossRef] [Google Scholar]
- Brinch, M., Greve, T. R., Sanders, D. B., et al. 2024, MNRAS, 527, 6591 [Google Scholar]
- Calzetti, D., Armus, L., Bohlin, R. C., et al. 2000, ApJ, 533, 682 [NASA ADS] [CrossRef] [Google Scholar]
- Capak, P. L., Riechers, D., Scoville, N. Z., et al. 2011, Nature, 470, 233 [Google Scholar]
- Carnall, A. C., McLure, R. J., Dunlop, J. S., & Davé, R. 2018, MNRAS, 480, 4379 [Google Scholar]
- Carnall, A. C., McLeod, D. J., McLure, R. J., et al. 2023a, MNRAS, 520, 3974 [NASA ADS] [CrossRef] [Google Scholar]
- Carnall, A. C., McLure, R. J., Dunlop, J. S., et al. 2023b, Nature, 619, 716 [NASA ADS] [CrossRef] [Google Scholar]
- Cha, S., Cho, B. Y., Joo, H., et al. 2025, ApJ, 987, L15 [Google Scholar]
- Chabrier, G. 2003, PASP, 115, 763 [Google Scholar]
- Chartab, N., Mobasher, B., Darvish, B., et al. 2020, ApJ, 890, 7 [NASA ADS] [CrossRef] [Google Scholar]
- Chartab, N., Newman, A. B., Rudie, G. C., et al. 2025, ApJ, 994, 106 [Google Scholar]
- Chiang, Y.-K., Overzier, R., & Gebhardt, K. 2013, ApJ, 779, 127 [Google Scholar]
- Chiang, Y.-K., Overzier, R. A., Gebhardt, K., & Henriques, B. 2017, ApJ, 844, L23 [Google Scholar]
- Clowe, D., Bradač, M., Gonzalez, A. H., et al. 2006, ApJ, 648, L109 [NASA ADS] [CrossRef] [Google Scholar]
- Conroy, C., & Gunn, J. E. 2010, ApJ, 712, 833 [Google Scholar]
- Cooper, M. C., Griffith, R. L., Newman, J. A., et al. 2012, MNRAS, 419, 3018 [NASA ADS] [CrossRef] [Google Scholar]
- Cucciati, O., Lemaux, B. C., Zamorani, G., et al. 2018, A&A, 619, A49 [NASA ADS] [CrossRef] [EDP Sciences] [Google Scholar]
- Daddi, E., Dannerbauer, H., Stern, D., et al. 2009, ApJ, 694, 1517 [Google Scholar]
- Daddi, E., Valentino, F., Rich, R. M., et al. 2021, A&A, 649, A78 [NASA ADS] [CrossRef] [EDP Sciences] [Google Scholar]
- Daddi, E., Rich, R. M., Valentino, F., et al. 2022, ApJ, 926, L21 [NASA ADS] [CrossRef] [Google Scholar]
- Dannerbauer, H., Kurk, J. D., De Breuck, C., et al. 2014, A&A, 570, A55 [NASA ADS] [CrossRef] [EDP Sciences] [Google Scholar]
- de Graaff, A., Brammer, G., Weibel, A., et al. 2025a, A&A, 697, A189 [NASA ADS] [CrossRef] [EDP Sciences] [Google Scholar]
- de Graaff, A., Setton, D. J., Brammer, G., et al. 2025b, Nat. Astron., 9, 280 [Google Scholar]
- Dekel, A., Birnboim, Y., Engel, G., et al. 2009, Nature, 457, 451 [Google Scholar]
- Di Mascolo, L., Saro, A., Mroczkowski, T., et al. 2023, Nature, 615, 809 [NASA ADS] [CrossRef] [Google Scholar]
- Eilers, A.-C., Mackenzie, R., Pizzati, E., et al. 2024, ApJ, 974, 275 [NASA ADS] [CrossRef] [Google Scholar]
- Ferland, G. J., Chatzikos, M., Guzmán, F., et al. 2017, Rev. Mex. Astron. Astrofis., 53, 385 [NASA ADS] [Google Scholar]
- Finkelstein, S. L., Bagley, M. B., Arrabal Haro, P., et al. 2025, ApJ, 983, L4 [Google Scholar]
- Fruchter, A. S., & Hook, R. N. 2002, PASP, 114, 144 [NASA ADS] [CrossRef] [Google Scholar]
- Gaia Collaboration (Brown, A. G. A., et al.) 2021, A&A, 649, A1 [NASA ADS] [CrossRef] [EDP Sciences] [Google Scholar]
- Galbiati, M., Cantalupo, S., Steidel, C., et al. 2025, A&A, 696, A95 [NASA ADS] [CrossRef] [EDP Sciences] [Google Scholar]
- Genin, A., Shuntov, M., Brammer, G., et al. 2025, A&A, 699, A343 [NASA ADS] [CrossRef] [EDP Sciences] [Google Scholar]
- Gobat, R., Daddi, E., Onodera, M., et al. 2011, A&A, 526, A133 [NASA ADS] [CrossRef] [EDP Sciences] [Google Scholar]
- Gobat, R., Daddi, E., Coogan, R. T., et al. 2019, A&A, 629, A104 [NASA ADS] [CrossRef] [EDP Sciences] [Google Scholar]
- Goerdt, T., Moore, B., Read, J. I., & Stadel, J. 2010, ApJ, 725, 1707 [Google Scholar]
- Gómez-Guijarro, C., Riechers, D. A., Pavesi, R., et al. 2019, ApJ, 872, 117 [CrossRef] [Google Scholar]
- Gould, K. M. L., Brammer, G., Valentino, F., et al. 2023, AJ, 165, 248 [NASA ADS] [CrossRef] [Google Scholar]
- Granato, G. L., Ragone-Figueroa, C., Domínguez-Tenreiro, R., et al. 2015, MNRAS, 450, 1320 [NASA ADS] [CrossRef] [Google Scholar]
- Grogin, N. A., Kocevski, D. D., Faber, S. M., et al. 2011, ApJS, 197, 35 [NASA ADS] [CrossRef] [Google Scholar]
- Guaita, L., Pompei, E., Castellano, M., et al. 2020, A&A, 640, A107 [NASA ADS] [CrossRef] [EDP Sciences] [Google Scholar]
- Harikane, Y., Ouchi, M., Ono, Y., et al. 2019, ApJ, 883, 142 [Google Scholar]
- Heintz, K. E., Brammer, G. B., Watson, D., et al. 2025, A&A, 693, A60 [Google Scholar]
- Huertas-Company, M., Shuntov, M., Dong, Y., et al. 2025, A&A, 704, A94 [NASA ADS] [CrossRef] [EDP Sciences] [Google Scholar]
- Husband, K., Bremer, M. N., Stanway, E. R., et al. 2013, MNRAS, 432, 2869 [NASA ADS] [CrossRef] [Google Scholar]
- Ito, K., Tanaka, M., Valentino, F., et al. 2023, ApJ, 945, L9 [NASA ADS] [CrossRef] [Google Scholar]
- Ito, K., Valentino, F., Brammer, G., et al. 2024, ApJ, 964, 192 [CrossRef] [Google Scholar]
- Ito, K., Valentino, F., Brammer, G., et al. 2025a, A&A, submitted [arXiv:2506.22642] [Google Scholar]
- Ito, K., Valentino, F., Farcy, M., et al. 2025b, A&A, 697, A111 [Google Scholar]
- Jin, S., Dannerbauer, H., Emonts, B., et al. 2021, A&A, 652, A11 [NASA ADS] [CrossRef] [EDP Sciences] [Google Scholar]
- Jin, S., Sillassen, N. B., Magdis, G. E., et al. 2023, A&A, 670, L11 [NASA ADS] [CrossRef] [EDP Sciences] [Google Scholar]
- Jin, S., Sillassen, N. B., Magdis, G. E., et al. 2024, A&A, 683, L4 [NASA ADS] [CrossRef] [EDP Sciences] [Google Scholar]
- Kakimoto, T., Tanaka, M., Onodera, M., et al. 2024, ApJ, 963, 49 [NASA ADS] [CrossRef] [Google Scholar]
- Kimmig, L. C., Remus, R.-S., Dolag, K., & Biffi, V. 2023, ApJ, 949, 92 [Google Scholar]
- Kodama, T., Arimoto, N., Barger, A. J., & Arag’on-Salamanca, A. 1998, A&A, 334, 99 [NASA ADS] [Google Scholar]
- Koekemoer, A. M., Faber, S. M., Ferguson, H. C., et al. 2011, ApJS, 197, 36 [NASA ADS] [CrossRef] [Google Scholar]
- Kokorev, V., Brammer, G., Fujimoto, S., et al. 2022, ApJS, 263, 38 [NASA ADS] [CrossRef] [Google Scholar]
- Kriek, M., Shapley, A. E., Reddy, N. A., et al. 2015, ApJS, 218, 15 [NASA ADS] [CrossRef] [Google Scholar]
- Kron, R. G. 1980, ApJS, 43, 305 [Google Scholar]
- Kubo, M., Umehata, H., Matsuda, Y., et al. 2021, ApJ, 919, 6 [NASA ADS] [CrossRef] [Google Scholar]
- Li, Q., Conselice, C. J., Sarron, F., et al. 2025, MNRAS, 539, 1796 [Google Scholar]
- Long, A. S., Antwi-Danso, J., Lambrides, E. L., et al. 2024, ApJ, 970, 68 [Google Scholar]
- Ludlow, A. D., Bose, S., Angulo, R. E., et al. 2016, MNRAS, 460, 1214 [Google Scholar]
- Mandelker, N., Nagai, D., Aung, H., et al. 2020, MNRAS, 494, 2641 [Google Scholar]
- McConachie, I., Wilson, G., Forrest, B., et al. 2022, ApJ, 926, 37 [NASA ADS] [CrossRef] [Google Scholar]
- Merlin, E., Fortuni, F., Torelli, M., et al. 2019, MNRAS, 490, 3309 [CrossRef] [Google Scholar]
- Miller, T. B., Chapman, S. C., Aravena, M., et al. 2018, Nature, 556, 469 [CrossRef] [Google Scholar]
- Montenegro-Taborda, D., Rodriguez-Gomez, V., Pillepich, A., et al. 2023, MNRAS, 521, 800 [NASA ADS] [CrossRef] [Google Scholar]
- Muldrew, S. I., Hatch, N. A., & Cooke, E. A. 2015, MNRAS, 452, 2528 [NASA ADS] [CrossRef] [Google Scholar]
- Navarro, J. F., Frenk, C. S., & White, S. D. M. 1996, ApJ, 462, 563 [Google Scholar]
- Nelson, D., Pillepich, A., Ayromlou, M., et al. 2024, A&A, 686, A157 [NASA ADS] [CrossRef] [EDP Sciences] [Google Scholar]
- Oke, J. B. 1974, ApJS, 27, 21 [Google Scholar]
- Oteo, I., Ivison, R. J., Dunne, L., et al. 2018, ApJ, 856, 72 [Google Scholar]
- Overzier, R. A. 2016, A&ARv, 24, 14 [Google Scholar]
- Paquereau, L., Laigle, C., McCracken, H. J., et al. 2025, A&A, 702, A163 [NASA ADS] [CrossRef] [EDP Sciences] [Google Scholar]
- Pavesi, R., Riechers, D. A., Sharon, C. E., et al. 2018, ApJ, 861, 43 [Google Scholar]
- Pentericci, L., Kurk, J. D., Röttgering, H. J. A., et al. 2000, A&A, 361, L25 [NASA ADS] [Google Scholar]
- Pérez-Martínez, J. M., Dannerbauer, H., Emonts, B. H. C., et al. 2025, A&A, 696, A236 [NASA ADS] [CrossRef] [EDP Sciences] [Google Scholar]
- Pozzetti, L., Bolzonella, M., Zucca, E., et al. 2010, A&A, 523, A13 [NASA ADS] [CrossRef] [EDP Sciences] [Google Scholar]
- Ramakrishnan, V., Moon, B., Im, S. H., et al. 2023, ApJ, 951, 119 [NASA ADS] [CrossRef] [Google Scholar]
- Rhee, J., Smith, R., Choi, H., et al. 2017, ApJ, 843, 128 [Google Scholar]
- Salim, S., Boquien, M., & Lee, J. C. 2018, ApJ, 859, 11 [Google Scholar]
- Sanchis, T., Łokas, E. L., & Mamon, G. A. 2004, MNRAS, 347, 1198 [NASA ADS] [CrossRef] [Google Scholar]
- Schaye, J., Kugel, R., Schaller, M., et al. 2023, MNRAS, 526, 4978 [NASA ADS] [CrossRef] [Google Scholar]
- Schechter, P. 1976, ApJ, 203, 297 [Google Scholar]
- Schmidt, M. 1968, ApJ, 151, 393 [Google Scholar]
- Schreiber, C., Pannella, M., Elbaz, D., et al. 2015, A&A, 575, A74 [NASA ADS] [CrossRef] [EDP Sciences] [Google Scholar]
- Schreiber, C., Glazebrook, K., Nanayakkara, T., et al. 2018, A&A, 618, A85 [NASA ADS] [CrossRef] [EDP Sciences] [Google Scholar]
- Shah, E. A., Lemaux, B., Forrest, B., et al. 2024, MNRAS, 529, 873 [NASA ADS] [CrossRef] [Google Scholar]
- Shahidi, A., Mobasher, B., Nayyeri, H., et al. 2020, ApJ, 897, 44 [NASA ADS] [CrossRef] [Google Scholar]
- Shen, X., Vogelsberger, M., Nelson, D., et al. 2022, MNRAS, 510, 5560 [NASA ADS] [CrossRef] [Google Scholar]
- Shimakawa, R., Kodama, T., Tadaki, K.-I., et al. 2014, MNRAS, 441, L1 [NASA ADS] [CrossRef] [Google Scholar]
- Shuntov, M., McCracken, H. J., Gavazzi, R., et al. 2022, A&A, 664, A61 [NASA ADS] [CrossRef] [EDP Sciences] [Google Scholar]
- Shuntov, M., Ilbert, O., Lagos, C. D. P., et al. 2025, A&A, submitted [arXiv:2511.05259] [Google Scholar]
- Sillassen, N. B., Jin, S., Magdis, G. E., et al. 2022, A&A, 665, L7 [NASA ADS] [CrossRef] [EDP Sciences] [Google Scholar]
- Sillassen, N. B., Jin, S., Magdis, G. E., et al. 2024, A&A, 690, A55 [NASA ADS] [CrossRef] [EDP Sciences] [Google Scholar]
- Sommer-Larsen, J., & Toft, S. 2010, ApJ, 721, 1755 [Google Scholar]
- Strazzullo, V., Daddi, E., Gobat, R., et al. 2016, ApJ, 833, L20 [NASA ADS] [CrossRef] [Google Scholar]
- Sun, H., Wang, T., Xu, K., et al. 2024, ApJ, 967, L34 [NASA ADS] [CrossRef] [Google Scholar]
- Sun, H., Wang, T., Daddi, E., et al. 2025, ApJ, 993, L49 [Google Scholar]
- Tanaka, M., Onodera, M., Shimakawa, R., et al. 2024, ApJ, 970, 59 [Google Scholar]
- Toshikawa, J., Kashikawa, N., Overzier, R., et al. 2016, ApJ, 826, 114 [NASA ADS] [CrossRef] [Google Scholar]
- Travascio, A., Cantalupo, S., Pezzulli, G., et al. 2025, A&A, submitted [arXiv:2508.20074] [Google Scholar]
- Uchiyama, H., Toshikawa, J., Kashikawa, N., et al. 2018, PASJ, 70, S32 [NASA ADS] [CrossRef] [Google Scholar]
- Umehata, H., Kubo, M., & Nakanishi, K. 2025, ApJ, 985, L8 [Google Scholar]
- Urbano Stawinski, S. M., Cooper, M. C., Finkelstein, S. L., et al. 2024a, MNRAS, 528, 5624 [Google Scholar]
- Urbano Stawinski, S. M., Cooper, M. C., Forrest, B., et al. 2024b, Open J. Astrophys., 7, 46 [Google Scholar]
- Valentino, F., Brammer, G., Gould, K. M. L., et al. 2023, ApJ, 947, 20 [NASA ADS] [CrossRef] [Google Scholar]
- Valentino, F., Heintz, K. E., Brammer, G., et al. 2025, A&A, 699, A358 [NASA ADS] [CrossRef] [EDP Sciences] [Google Scholar]
- Valentinuzzi, T., Poggianti, B. M., Fasano, G., et al. 2011, A&A, 536, A34 [NASA ADS] [CrossRef] [EDP Sciences] [Google Scholar]
- van der Burg, R. F. J., Muzzin, A., Hoekstra, H., et al. 2014, A&A, 561, A79 [NASA ADS] [CrossRef] [EDP Sciences] [Google Scholar]
- Walter, F., Decarli, R., Carilli, C., et al. 2012, Nature, 486, 233 [Google Scholar]
- Wang, T., Elbaz, D., Daddi, E., et al. 2016, ApJ, 828, 56 [NASA ADS] [CrossRef] [Google Scholar]
- Wang, T., Xu, K., Wu, Y., et al. 2024, Nature, 632, 1009 [NASA ADS] [CrossRef] [Google Scholar]
- Ward, E., de la Vega, A., Mobasher, B., et al. 2024, ApJ, 962, 176 [NASA ADS] [CrossRef] [Google Scholar]
- Weaver, J. R., Kauffmann, O. B., Ilbert, O., et al. 2022, ApJS, 258, 11 [NASA ADS] [CrossRef] [Google Scholar]
- Weigel, A. K., Schawinski, K., & Bruderer, C. 2016, MNRAS, 459, 2150 [NASA ADS] [CrossRef] [Google Scholar]
- Wetzel, A. R., Tinker, J. L., & Conroy, C. 2012, MNRAS, 424, 232 [NASA ADS] [CrossRef] [Google Scholar]
- Williams, R. J., Quadri, R. F., Franx, M., van Dokkum, P., & Labbé, I. 2009, ApJ, 691, 1879 [NASA ADS] [CrossRef] [Google Scholar]
- Willis, J. P., Canning, R. E. A., Noordeh, E. S., et al. 2020, Nature, 577, 39 [NASA ADS] [CrossRef] [Google Scholar]
- Xu, K., Wang, T., Daddi, E., et al. 2025, A&A, submitted [arXiv:2503.21724] [Google Scholar]
- Yang, T., Wang, T., Xu, K., et al. 2025, ArXiv e-prints [arXiv:2510.12235] [Google Scholar]
- Zhou, D., Chapman, S. C., Aravena, M., et al. 2026, Nature [Google Scholar]
- Zhou, L., Wang, T., Daddi, E., et al. 2024, A&A, 684, A196 [NASA ADS] [CrossRef] [EDP Sciences] [Google Scholar]
We use Mh(n) as short to refer to the n-th halo mass method presented in Sillassen et al. (2024)
Appendix A: Depths of observations
We estimated the 5σ depths of the observations using four methods: (1) using the depth where the observed magnitudes deviate from a power-law by 20% (Sect. 2.1, Fig. B.1); (2) measuring the magnitude of the faintest 5σ detected galaxy in each band in the catalogue; (3) fitting the negative flux distribution of all pixels in the images with a gaussian, and accounting for the number of pixels covered by a single aperture; and (4) placing random apertures in the images, avoiding bright sources, and fitting the flux distribution with a gaussian.
5σ depths measured in 0.7″ apertures.
Appendix B: Completeness
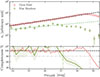 |
Fig. B.1. JWST/F444W Completeness of the entire CEERS field (red), and the confirmed and candidate members of the Cosmic Vine (green). |
Appendix C: Spectroscopic redshifts
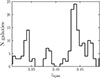 |
Fig. C.1. Distribution of spectroscopically confirmed galaxies at 3.3 < zspec < 3.5 in the CEERS field. |
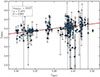 |
Fig. C.2. Comparison between spectroscopic redshift and EAZY photometric redshift, for spectroscopically confirmed galaxies in CEERS with 3.3 < zspec < 3.5. |
Appendix D: Mass-size relation fits
Fitted and literature mass-size relations.
All Tables
All Figures
|
Fig. 1. Left: colour image of the densest region of the Vine and the Leaf. Colours correspond to JWST/F150W, F277W, and F444W as the blue, green, and red channels respectively. The projected density is shown as white contours at 2, 3, and 4σ levels. The virial radii of the six most massive identified dark matter halos are marked with magenta dashed circles. Quiescent members of the Cosmic vine are marked with orange circles, spectroscopically confirmed members of the Cosmic Vine are marked with green circles, spec-z confirmed members of the Leaf are marked with yellow circles, and candidate members with cyan circles. Right: NIRCam/F150W, F277W, and F444W colour images of 11 quiescent galaxies in the Cosmic Vine. The field of view of each cutout is 2″. |
| In the text | |
|
Fig. 2. Left: rest-frame UVJ diagram of protocluster members. The colour selection function is shown in black lines. Identified quiescent galaxies are marked with a star. The sSFRs of the galaxies is coded in colour. The cross in the bottom right corner shows the average uncertainty Right: colour-magnitude diagram of quiescent (red stars) and star-forming (blue dots) members. The background hexagons show the density of field galaxies. Overlaid is a linear fit to the quiescent galaxies (black dashed) and the scatter (gray dot-dashed), with the slope and intercept at MF200W = 21 shown in text. The observational depth is shown with a gray dotted line. |
| In the text | |
|
Fig. 3. Stellar mass functions (SMFs) and quiescent fractions. Left: SMFs for the star-forming (light blue) and quiescent (red) members of the Vine, fitted with a Schechter function. The black dots and line show the CEERS SFG field sample, and the orange dots and line show the CEERS QG sample. The vertical lines mark the stellar mass completeness limit of the field (black) and Cosmic Vine members (blue). Right: quiescent fractions of Cosmic Vine members (red) and the rest of the CEERS field (black). Blue dots with error bars represent the quiescent fractions from the JWST/PRIMER fields at z ∼ 3.45 (Yang et al. 2025). |
| In the text | |
|
Fig. 4. Mass–size relation of star-forming members (blue), quiescent members (red), field SFGs (black), and field QGs (green). Power-law fits to SFG members and field SFGs are shown with blue solid and black dotted lines respectively, with the fit uncertainty of SFG members shown as shaded region. Mass–size relations of late type galaxies from Ward et al. (2024, green line) and quiescent galaxies from Ito et al. (2024, red line) are overplotted, the relations are extrapolated for SFGs with M* < 109.5 M⊙ and QGs with M* < 1010.3 M⊙. The vertical dashed lines show the mass completeness limit of the CEERS field (gray) and Cosmic Vine (blue). |
| In the text | |
|
Fig. 5. Phase-space diagrams for spectroscopically confirmed members and subgroups. Left: galaxies are sized and coloured according to the stellar mass. Measured velocity differences are multiplied with a factor of |
| In the text | |
|
Fig. B.1. JWST/F444W Completeness of the entire CEERS field (red), and the confirmed and candidate members of the Cosmic Vine (green). |
| In the text | |
|
Fig. C.1. Distribution of spectroscopically confirmed galaxies at 3.3 < zspec < 3.5 in the CEERS field. |
| In the text | |
|
Fig. C.2. Comparison between spectroscopic redshift and EAZY photometric redshift, for spectroscopically confirmed galaxies in CEERS with 3.3 < zspec < 3.5. |
| In the text | |
Current usage metrics show cumulative count of Article Views (full-text article views including HTML views, PDF and ePub downloads, according to the available data) and Abstracts Views on Vision4Press platform.
Data correspond to usage on the plateform after 2015. The current usage metrics is available 48-96 hours after online publication and is updated daily on week days.
Initial download of the metrics may take a while.