Fig. 5.
Download original image
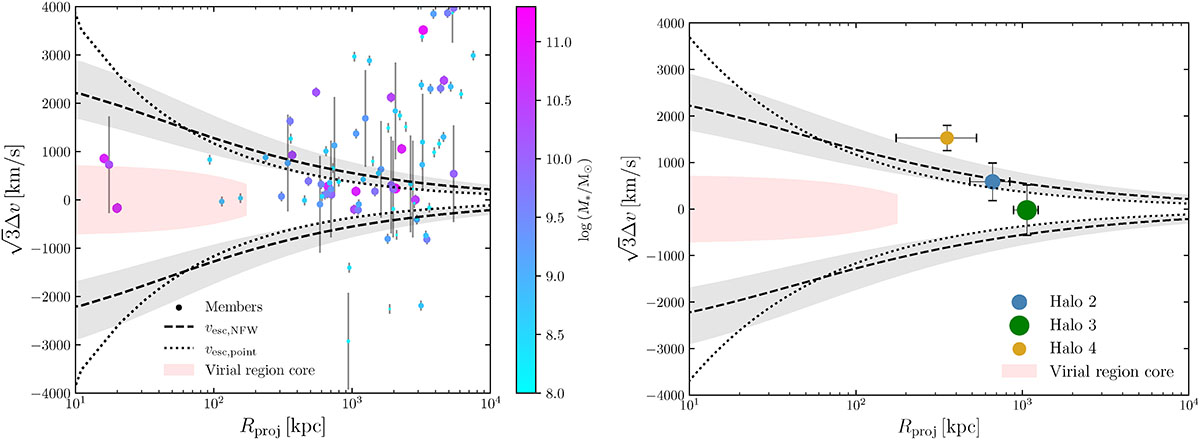
Phase-space diagrams for spectroscopically confirmed members and subgroups. Left: galaxies are sized and coloured according to the stellar mass. Measured velocity differences are multiplied with a factor of ![]() , to account for measuring projected velocities (Rhee et al. 2017). Right: phase-space diagram for the subgroups with sizes coded with the estimated halo mass (Table 3). The errorbars on the subgroups show the estimated virial radius in the radial direction, and the uncertainty on the central velocity in the velocity direction. Overlaid: vesc, NFW calculated as a NFW profile with chalo = 20.46 shown as a black dashed line, and vesc, point as a point mass distribution (chalo → ∞) shown as a black dotted line. The virial region of the core is defined as vr < vr, crit and R < Rvir from Sanchis et al. (2004), which is shown with a red shaded area.
, to account for measuring projected velocities (Rhee et al. 2017). Right: phase-space diagram for the subgroups with sizes coded with the estimated halo mass (Table 3). The errorbars on the subgroups show the estimated virial radius in the radial direction, and the uncertainty on the central velocity in the velocity direction. Overlaid: vesc, NFW calculated as a NFW profile with chalo = 20.46 shown as a black dashed line, and vesc, point as a point mass distribution (chalo → ∞) shown as a black dotted line. The virial region of the core is defined as vr < vr, crit and R < Rvir from Sanchis et al. (2004), which is shown with a red shaded area.
Current usage metrics show cumulative count of Article Views (full-text article views including HTML views, PDF and ePub downloads, according to the available data) and Abstracts Views on Vision4Press platform.
Data correspond to usage on the plateform after 2015. The current usage metrics is available 48-96 hours after online publication and is updated daily on week days.
Initial download of the metrics may take a while.