Fig. 1.
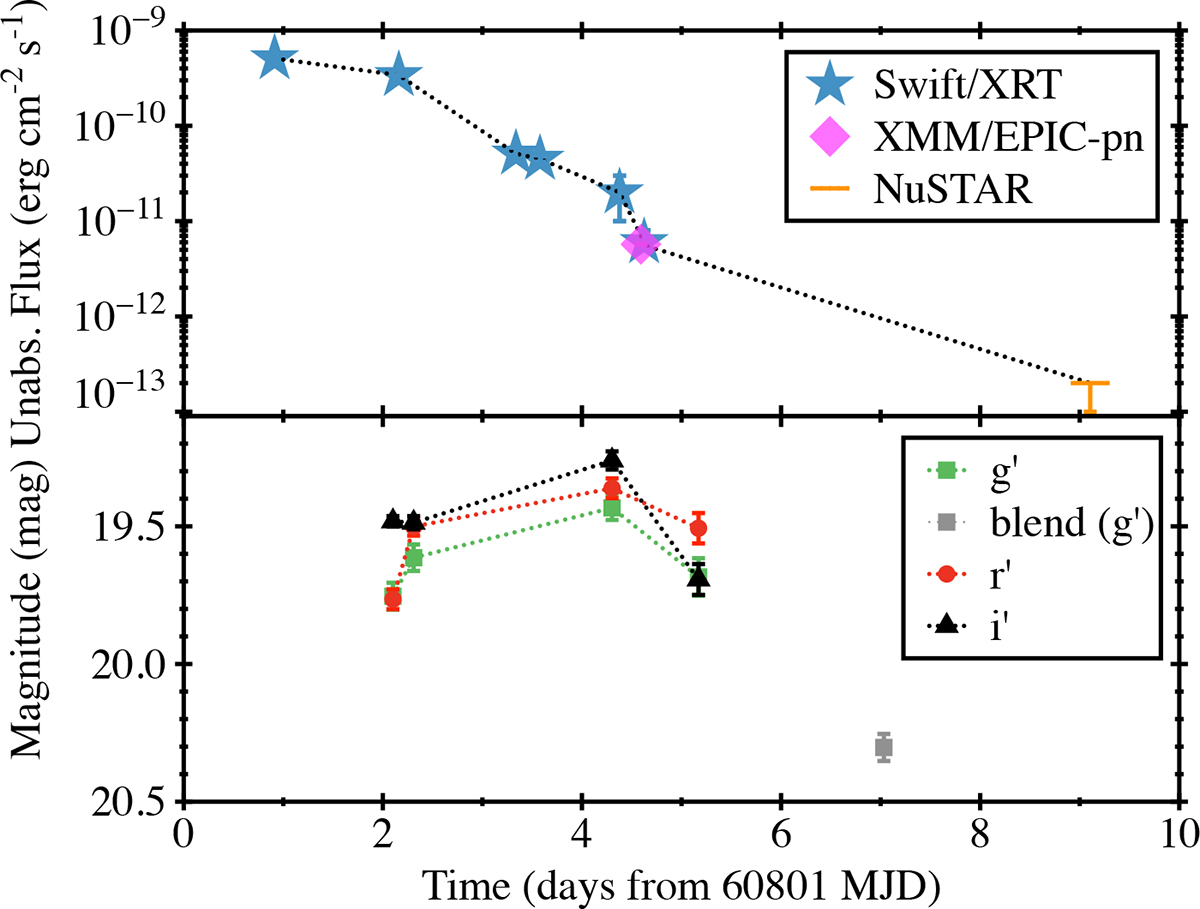
Download original image
Multi-wavelength light curves of MAXI J1957+032 during the 2025 outburst. Top: 0.5–10 keV unabsorbed flux measured with Swift/XRT (blue points) and the XMM-Newton/PN observation (pink point). Bottom: Optical g′, r′, and i′ magnitudes from LCO (see Sect. 2.4). An additional observation performed on May 13, 2025 (MJD 60808), corresponding to the blend of MAXI J1957+032 with a g′∼20 nearby star, is shown for comparison. Error bars represent 1σ uncertainties.
Current usage metrics show cumulative count of Article Views (full-text article views including HTML views, PDF and ePub downloads, according to the available data) and Abstracts Views on Vision4Press platform.
Data correspond to usage on the plateform after 2015. The current usage metrics is available 48-96 hours after online publication and is updated daily on week days.
Initial download of the metrics may take a while.