| Issue |
A&A
Volume 706, February 2026
|
|
|---|---|---|
| Article Number | A204 | |
| Number of page(s) | 14 | |
| Section | Astrophysical processes | |
| DOI | https://doi.org/10.1051/0004-6361/202557859 | |
| Published online | 10 February 2026 | |
Flashing fast: Characterising the 2025 outburst of MAXI J1957+032
1
Dipartimento di Fisica, Università degli Studi di Cagliari, SP Monserrato-Sestu KM 0.7 Monserrato 09042, Italy
2
INAF-Osservatorio Astronomico di Brera Via Bianchi 46 I-23807 Merate (LC), Italy
3
Center for Astrophysics and Space Science (CASS), New York University Abu Dhabi PO Box 129188 Abu Dhabi, UAE
4
European Space Science (ESA), European Space Astronomy Center (ESAC), Camino Bajo del Castillo s/n E-28692 Villanueva de la Cañada Madrid, Spain
5
ASI – Agenzia Spaziale Italiana Via del Politecnico snc 00133 Roma, Italy
6
Institute of Space Sciences (ICE, CSIC), Campus UAB Carrer de Can Magrans s/n E-08193 Barcelona, Spain
7
Institut d’Estudis Espacials de Catalunya (IEEC) 08860 Castelldefels (Barcelona), Spain
8
INAF-IASF Palermo Via Ugo La Malfa 153 90146 Palermo, Italy
9
INAF-Osservatorio Astronomico di Roma, Via Frascati 33 I-00076 Monte Porzio Catone (RM), Italy
10
Dipartimento di Fisica e Chimica - Emilio Segre, Università di Palermo via Archirafi 36 90123 Palermo, Italy
11
Faulkes Telescope Project, School of Physics and Astronomy, Cardiff University The Parade Cardiff CF24 3AA Wales, UK
12
The Schools’ Observatory, Astrophysics Research Institute, Liverpool John Moores University 146 Brownlow Hill Liverpool L3 5RF, UK
13
South African Astronomical Observatory P.O Box 9 Observatory 7935 Cape Town, South Africa
★ Corresponding author: This email address is being protected from spambots. You need JavaScript enabled to view it.
Received:
27
October
2025
Accepted:
11
December
2025
Abstract
Context. MAXI J1957+032 is an accreting millisecond X-ray pulsar that shows brief, recurrent outbursts within an ultra-compact ≈1 h orbit.
Aims. We characterised the X-ray timings and spectral and optical properties during the 2025 outburst and measured the long-term spin evolution relative to its previous 2022 outburst.
Methods. We analysed X-ray observations from XMM-Newton, Swift, and NuSTAR, together with contemporaneous optical photometry obtained with LCO during the 2025 outburst. X-ray timing analysis included standard epoch-folding and coherent searches, while energy-resolved pulse profiles were studied through harmonic decomposition. Spectral fits used absorbed thermal–Comptonisation models complemented with a soft blackbody component, whose emission radius suggests that the blackbody emission originates from a hotspot on the neutron star surface.
Results. Coherent pulsations were detected at ν ≈ 313.6 Hz, with no measurable frequency derivative within the XMM-Newton exposure. Via comparisons with the 2022 outburst, we find a long-term spin-down of ⟨ν˙⟩ ∼ −2 × 10⁻¹⁴ Hz s−1, consistent with magnetic dipole braking during quiescence. The pulse shape is almost sinusoidal, showing significant power at the fundamental, second, and fifth harmonics. The fractional amplitude decreases with increasing flux and exhibits soft lags extending to a few keV. The X-ray spectrum between 0.5 and 10 keV is well reproduced by a thermal–Comptonised continuum with photon index Γ ≈ 2.4, plus a cool blackbody with kT ≈ 0.23 keV. No reflection or Fe-line features are detected. Assuming Rm ≲ Rco, the magnetic field is limited to Bs ≈ (0.5–3)×108 G (for d = (5 ± 2) kpc and truncation factor ξ = 0.3–0.5), lower than the upper limit implied by the secular spin-down (Bp ≲ 109 G), possibly indicating a mildly leaky propeller regime. The optical and infrared (OIR) emission follows the neutron-star branch of the LOIR–LX relation, consistent with X-ray reprocessing in a compact accretion disc. The optical spectral energy distributions are broadly flat, supporting irradiation-dominated disc emission, and an early red excess suggests a jet contribution during the initial hard X-ray phase. A delayed optical peak relative to the X-rays may reflect the outward propagation of a heating front through the disc, consistent with rapid disc evolution in short-lived outbursts.
Key words: accretion / accretion disks / stars: neutron / pulsars: general
© The Authors 2026
 Open Access article, published by EDP Sciences, under the terms of the Creative Commons Attribution License (https://creativecommons.org/licenses/by/4.0), which permits unrestricted use, distribution, and reproduction in any medium, provided the original work is properly cited.
This article is published in open access under the Subscribe to Open model. This email address is being protected from spambots. You need JavaScript enabled to view it. to support open access publication.
1. Introduction
Neutron stars (NSs) hosted in low-mass X-ray binaries (LMXBs) owe their typical rapid periods, i.e. of the order of a millisecond, to a prolonged accretion of angular momentum from a companion that barely reaches the solar-mass scale (Alpar et al. 1982; Wijnands & van der Klis 1998). Gas streaming through the inner Lagrange point settles into a Keplerian disc (e.g. Shakura & Sunyaev 1973; Frank et al. 2002). Once the flow is magnetically channelled onto the NS surface (Ghosh & Lamb 1979a,b), hotspots sweep across our line of sight, imprinting X-ray pulsations at hundreds of hertz (see e.g. Psaltis & Chakrabarty 1999; Poutanen & Beloborodov 2006). These ‘recycled’ accretors, first predicted four decades ago and observed soon after, now number a few dozen (see Di Salvo & Sanna 2020; Patruno & Watts 2021, for extensive reviews) and bridge the evolutionary gap between non-pulsating LMXBs (in which no coherent millisecond pulsations have been detected so far) and radio millisecond pulsars.
A crucial trait of the class of accreting millisecond X-ray pulsars (AMXPs) is their transience (see e.g. Wijnands & van der Klis 1998; Campana & Di Salvo 2018). A possible scenario envisions a disc that is usually too cool and tenuous to conduct matter inwards (Lasota 2001). Still, every so often, a thermal-viscous runaway can heat the flow, raise the accretion rate by orders of magnitude, and ignite an X-ray outburst. These events are frequently accompanied by optical and near-infrared emission driven by X-ray irradiation of the accretion disc and, in some cases, of the companion star (see e.g. van Paradijs & McClintock 1994; Hynes 2005; Russell et al. 2006, 2007). Monitoring this component provides a complementary view of the accretion process, as the optical flux reflects both the geometry and the efficiency of X-ray reprocessing. In the canonical disc-instability picture (Meyer & Meyer-Hofmeister 1981; King 1998; Hameury 2020), outbursts can last for weeks to months, yet theory also predicts markedly briefer episodes if the accretion disc has a particularly small radial extent, as anticipated for ultra-compact systems (see e.g. Hameury & Lasota 2016; Marino et al. 2019), or if it is truncated close to the magnetosphere (see e.g. Burderi & King 1998; Kulkarni & Romanova 2013; Bozzo et al. 2018). Simulations tailored to hydrogen-poor predictions for ultra-compact binaries suggest that eruptive cycles can empty the entire reservoir in only a few days, an expectation supported by observations of several AMXPs (see e.g. Hameury & Lasota 2016; Marino et al. 2019; Heinke et al. 2025). Statistical work indicates that the outburst recurrence rate, and to a lesser extent the duration, depends on the orbital period, reflecting differences in disc size and mass transfer across LMXBs. In particular, systems with Porb ≲ 12 h tend to have much lower observed outburst rates than longer-period systems (Lin et al. 2019). However, this trend does not appear to hold within the subclass of AMXPs, which occupy the short-period regime (typically Porb ≲ 5 h) and show no clear correlation between orbital period and outburst frequency. Their uniformly compact accretion discs and low mass-transfer rates likely produce infrequent and irregular outbursts, making them a distinct observational population within the broader LMXB family. Although AMXPs are not generally classified as very faint X-ray transients (VFXTs), their low outburst luminosities overlap with the LX ∼ 1034–1036 erg s−1 regime, where NS VFXTs show similar softening trends (see e.g. Wijnands et al. 2015).
MAXI J1957+032 sits at the sharp end of this ‘flash-outburst’ sub-population. Since its discovery (Negoro et al. 2015), the source has undergone roughly half a dozen outbursts; each outburst has risen, peaked at ∼1036 erg s−1 (0.5–10 keV), and faded back into quiescence in ≲5 d at flux values of a few 1033 erg s−1 (see e.g. Ravi 2017; Mata Sánchez et al. 2017, and references therein). Coherent pulsations at ∼314 Hz and a Doppler-shifted orbital period of ≃1 h certify the system as an ultra-compact accreting millisecond pulsar, implying a disc radius of only a few 109 cm and an extremely low-mass donor, possibly a brown dwarf (Ng et al. 2022; Sanna et al. 2022a) or a carbon-oxygen white dwarf (Ravi 2017). The latest outburst detected by the Einstein Probe telescope on May 6, 2025 (Sun et al. 2025), and confirmed by MAXI Gas Slit Camera (GSC) and the Swift X-ray Telescope (XRT) (Negoro et al. 2025; Williams et al. 2025; Illiano et al. 2025), once again followed the same rapid template, barely reaching a few 1036 erg s−1 before disappearing below monitor detectability within a week (Li et al. 2025). Timing analysis of the Einstein Probe dataset confirmed a new outburst of the source by detecting coherent pulsations at the expected spin frequency reported in the literature (Li et al. 2025). A broadband view of the 2025 outburst, combining the X-ray and optical coverage, is shown in Fig. 1.
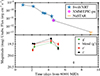 |
Fig. 1. Multi-wavelength light curves of MAXI J1957+032 during the 2025 outburst. Top: 0.5–10 keV unabsorbed flux measured with Swift/XRT (blue points) and the XMM-Newton/PN observation (pink point). Bottom: Optical g′, r′, and i′ magnitudes from LCO (see Sect. 2.4). An additional observation performed on May 13, 2025 (MJD 60808), corresponding to the blend of MAXI J1957+032 with a g′∼20 nearby star, is shown for comparison. Error bars represent 1σ uncertainties. |
Here we report on the timing and spectral properties of MAXI J1957+032 as observed with XMM-Newton in a dedicated target of opportunity observation taken during its latest outburst. To trace the spectral evolution, we also utilised a Swift/XRT monitoring campaign, and we included optical photometry obtained during the same epoch to investigate the behaviour of the irradiated accretion disc. In addition to the XMM-Newton and Swift datasets, a NuSTAR observation was obtained nine days after the outburst peak. Since the source was not significantly detected in this pointing and no useful timing or spectral constraints could be derived, the dataset was not used in our analysis. For completeness, the observation and basic count-rate estimates are described in Sect. 2.2.
2. Observation and data reduction
2.1. XMM-Newton
XMM-Newton (Jansen et al. 2001) performed a target of opportunity observation of MAXI J1957+032 (Obs. ID. 0971190201) on May 10, 2025, starting from 08:43 UTC till 22:02 UTC. Different instruments were set up for the observations, including the EPIC-pn camera, which was operated in timing mode for the first ∼32.8 ks and switched to burst mode for the remaining ∼8.9 ks of coverage. Both EPIC-MOS cameras were operated in timing mode, while the RGS was in spectroscopy mode. Although both EPIC-MOS cameras were configured in timing mode, we did not use MOS data for timing analysis due to limited calibration (see e.g. Valencic et al. 2016) and absolute-timing scatter of the order of ≈ ± 10 ms (estimates from Crab cross-checks). For this work, we focused solely on the PN dataset taken in timing mode, discarding the burst-mode interval because its 3% duty cycle resulted in only ∼1000 surviving photons, too few for reliable spectral or timing analysis.
We performed screening and cleaning of the PN events using the Science Analysis Software (SAS) v.21 with up-to-date calibration files. We extracted source photons limiting their energy in the range 0.5–10 keV, and by retaining only calibrated photons characterised by PATTERN ≤ 4 and (FLAG = 0). We isolated source and background photons from a 23-pixel-wide strip (RAWX = 26–48) centred on the brightest pixel column and an 11-pixel-wide (RAWX = 3–13) strip in the tail of the RAWX distribution, respectively. We investigated the presence of flaring activity above 10 keV by generating a 20-s time-bin-resolution light curve from PN timing-mode events extracted from the source, and we identified none. From the same dataset, we generated the 0.5–10 keV light curve, showing an average count rate of around 3 counts/s, with a clear decreasing trend from ∼4 to ∼1.5 counts/s. We did not observe either type-I X-ray bursts or the partial occultation of the source count rate during the PN exposure time. The PN light curve described here is shown, together with the optical monitoring, in the multi-wavelength outburst overview presented in Fig. 1. For the timing analysis, we applied barycentric corrections of the photon arrival times to the Solar System barycentre by using the BARYCEN tool (DE-405 solar system ephemeris) and adopting the best available source coordinates of the source (Chakrabarty et al. 2016) reported in Table 1.
Timing solutions for MAXI J1957+032 during the observed outbursts.
2.2. NuSTAR
NuSTAR triggered a pointed observation of MAXI J1957+032 (Obs. ID 91101312002) starting on May 14, 2025, 13:45 UTC and ending on May 15, 2025, 15:25 UTC for a total coverage time of ∼92.4 ks. We processed the NuSTAR observation using the standard pipeline in NUSTARDAS (HEASOFT v6.33.2), applying the default screening and filtering to produce cleaned event lists for FPMA and FPMB. Source and background events were extracted with circular apertures centred on the target and on a source-free region in the same detector quadrant, respectively; light curves and spectra (with response files) were generated with NUPRODUCTS. Background-subtracted light curves for each module and the combined dataset were obtained with LCMATH.
The exposure after screening amounts to ∼46 ks. In the whole 3–80 keV band, we measure a total of 2779 net counts when summing FPMA and FPMB, corresponding to a mean background-subtracted rate of ≈6.1 × 10⁻² counts/s (i.e. ∼3 × 10⁻² counts/s per module).
Using the spectral parameters from the nearest Swift/XRT observation, we estimated the corresponding NuSTAR 3–20 keV flux via WebPIMMS. The inferred flux, of order a few ×10−13 erg cm−2 s−1, is shown in Fig. 1, and confirms that MAXI J1957+032 had already returned to quiescence, providing no useful timing or spectral constraints.
2.3. Swift
The Swift (Gehrels et al. 2004) XRT (Burrows et al. 2005) observed MAXI J1957+032 ten times during its 2025 outburst (see Table A.1). The first XRT observation was carried out in photon counting (PC) mode on May 6, 2025 (Williams et al. 2025), confirming the onset of the outburst. A dedicated monitoring campaign then followed, with a series of observations performed approximately every six hours in windowed timing (WT) mode between May 8 and May 11, 2025 (PI: Illiano), tracking the outburst evolution with high cadence. Finally, a last observation in PC mode was conducted on May 15, 2025, to confirm the source’s return to quiescence (Illiano et al. 2025).
The raw, level-1 data were processed using xrtpipeline with standard parameters. The first PC-mode observation (Obs. ID: 00019768001) was affected by pile-up. To mitigate it, we extracted source photons from an annular region centred on the source coordinates with inner and outer radii of 16 and 30 pixels, respectively (1 pixel = 2.36 arcsec). The background was estimated from a concentric annular region with inner and outer radii of 40 and 80 pixels, respectively. The subsequent set of observations, carried out in WT mode, was analysed using a circular region with a radius of 20 pixels, centred on the source position for extracting the source photons, and a background region of the same size located away from the source.
All spectra were extracted in the 0.3–10 keV energy range and re-binned to ensure a minimum of 25 counts per bin, except for two WT-mode observations (Obs. IDs 00033770039 and 00033770040), which had low statistics and a background-dominated high-energy range. These spectra were instead grouped to have at least 10 counts per bin and fitted using a modified version of the Cash statistic that accounts for background effects (W-statistic1) in the 0.5–10 keV and 0.5–9 keV energy ranges, respectively.
The spectra from Obs. IDs 00033770041 and 00033770042 were excluded from the analysis because the source was detected only below 3 keV in both cases, which precluded a reliable determination of spectral parameters. We also attempted to combine these two observations to improve the statistics, but the resulting re-normalisation factors used in the spectral modelling showed inconsistencies, as expected given the rapid decay phase of the source (see Fig. 1, top panel). Finally, the last PC-mode observation was not analysed, as the source was no longer detected, consistent with the quiescent state reported by Illiano et al. (2025). Both the sosta tool and the Swift/XRT online product generator returned a 3σ upper limit on the count rate of ∼6 × 10⁻³ counts/s in ∼1.8 ks of exposure. Assuming the latest spectrum reported in Table A.2, this corresponds to a 3σ upper limit on the unabsorbed 0.5–10 keV flux of ∼2 × 10⁻¹³ erg cm−2 s−1. The time evolution of the XRT unabsorbed fluxes is shown in Fig. 1.
2.4. Las Cumbres Observatory
MAXI J1957+032 was monitored during its 2025 outburst in the optical band using the 1 m and 2 m telescopes of the Las Cumbres Observatory (LCO) network, as part of an ongoing programme monitoring approximately 50 LMXBs (Lewis et al. 2008). Observations were obtained with the Sloan Digital Sky Survey (SDSS) g′, r′, i′, and z filters, beginning on May 6, 2025 (MJD 60803), approximately one day after the first X-ray detection, and continuing until May 30, 2025. The target lies within ∼2″ of a nearby star with g′∼20 mag. Depending on the seeing conditions and on the brightness of MAXI J1957+032 at the time of observation, the two sources could appear partially blended. When the transient was bright, close to the outburst peak, it could be clearly resolved and accurately measured. At fainter stages, however, especially under poor seeing, the two objects became indistinguishable, and all such images were identified through visual inspection and discarded from the analysis. Given the short duration of the outburst, MAXI J1957+032 became too faint to be clearly separated from the nearby star after only about three days of optical monitoring. This work will therefore focus mainly on optical observations acquired between May 8 and May 11, 2025 (MJD 60803–60806). All observations during this period were obtained with the 1 m telescopes of the LCO network.
The z-band frames were collected only when the source was blended or too faint, while Y-band data yielded upper limits during unblended epochs. Accordingly, we restricted our analysis to the g′, r′, and i′ bands. Photometry was extracted with the X-ray Binary New Early Warning System XB-NEWS pipeline (Russell et al. 2019; Goodwin et al. 2020), which performs multi-aperture photometry (MAP; Stetson 1990) and automated astrometric and photometric calibration. Details of the reduction, calibration procedure, and final magnitudes are provided in Appendix B (see Table B.1). The resulting optical light curves are shown together with the X-ray evolution in Fig. 1.
3. Results
3.1. Timing analysis
All photon arrival times from the PN camera were barycentred using BARYCEN and corrected for the binary motion assuming a circular orbit. We propagated the orbital solution from the 2022 NICER outburst (Sanna et al. 2022a) to the present epoch and scanned the time of ascending node within its ±3σ range in 1-s steps.
For each trial, photon arrival times were first corrected to the Solar System barycentre using BARYCEN, which removes the delays caused by the Earth’s motion. We then applied an orbital demodulation by subtracting the Roemer delay expected from a circular binary orbit. After this two–step procedure, the events were folded into 32 phase bins while scanning the spin frequency around the 2022 value (ν0 = 313.64374049 Hz) with 10−7 Hz increments. The χ2 periodogram yielded a single significant maximum at Tasc = 60805.36786(1) MJD and ν = 313.64373842(35) Hz. The frequency uncertainty was estimated from the curvature of the χ2(ν) peak and via bootstrap resampling of the photon list, yielding consistent results within 2%.
Using the optimal orbital solution and spin frequency from the folding search, we conducted a fully phase-coherent analysis of the PN events. To avoid mixing intervals with very different signal-to-noise ratios (S/N), we first partitioned the observation into contiguous segments selected by the multi-harmonic H-test (de Jager et al. 1989; de Jager & Büsching 2010). The test was evaluated on unbinned photon phases up to mmax = 10 harmonics, and we retained only intervals with single-trial significance exceeding 5σ. This procedure yielded 73 segments covering ∼33 ks (99.6% of the good exposure), with a median duration of 445 s and a median of ∼1065 photons per segment. The median H-statistic is 36.3. The harmonic order that maximises the H-test varies mildly across the observation – most segments are consistent with a fundamental-only signal or a modest contribution from the second harmonic – indicating limited pulse-shape evolution and a profile dominated by the fundamental. A per-harmonic assessment with the unbinned Zk2 statistic – with 2 degrees of freedom (d.o.f.) – further shows that neither the second nor higher harmonics are individually significant at ≥3σ in any segment, so the segment-level signal is overwhelmingly carried by the fundamental.
For each valid segment, the pulse phase was obtained by maximising the unbinned periodicity statistic with respect to a simple phase shift, adopting the same number of harmonics, m★, that maximised the H-test (Buccheri et al. 1993). The phase was measured relative to a high-S/N template built from the entire dataset and expressed as a truncated Fourier series with coefficients Tk (k ≤ m★). For every segment, we calculated the complex Fourier coefficients ak from the photon phases and determined the shift that maximised their correlation with the template. This procedure is mathematically equivalent to an unbinned cross-correlation in phase space applied simultaneously to all harmonics. The statistical uncertainty for each phase was derived from non-parametric bootstrap resampling (Nboot = 103) of the photon list, preserving the signal’s periodicity. The 1σ error was defined as the circular standard deviation of the recovered phase distribution. For a subset of segments, we also performed a parametric bootstrap based on simulated photon lists drawn from the Fourier template; the resulting scatter agreed within a few per cent with the non-parametric errors, supporting the reliability of the adopted estimates.
The resulting set of pulse phases was fitted with a small-eccentricity timing model using standard phase-coherent techniques (see e.g. Burderi et al. 2007; Sanna et al. 2016). We started from the folding solution (Tasc = 60805.36786(1) MJD, and ν = 313.64373842(35) Hz), allowing differential corrections to be applied to all model parameters. Folding, phase extraction and the weighted fit were iterated until parameter updates were negligible compared to their formal uncertainties. Best-fit parameters from the coherent analysis are reported in Table 1. As customary for AMXPs, we adopted parameter errors inflated by  to account for any residual phase noise not captured by the statistical uncertainties (Finger et al. 1999). We also added, in quadrature, the systematic contribution to the spin frequency uncertainty due to the source position, following Eq. (4) of Papitto et al. (2011). For our astrometry this term is ≃3.2 × 10⁻⁸ Hz and increases the total 1σ error by < 1%.
The post-fit phase residuals for each H-test-selected segment show no systematic long-term drift across the observation (Fig. 2, bottom panel). Their scatter is statistically consistent with the weighted coherent fit (Table 1), and augmenting the model with either a spin-frequency derivative ( ) or an orbital-period derivative (Ṗorb) does not yield a significant improvement. A modest excursion of the residuals is visible near the middle of the exposure; however, the phase promptly returns to the pre-excursion level, and the data require no persistent step. On the other hand, during the 2022 NICER campaign (see Fig. 1 in Sanna et al. 2022a), a discrete phase jump was observed around MJD 59750.2, which persisted thereafter. Over the ∼33 ks timescale covered by the XMM-Newton/PN observation, the timing behaviour is therefore consistent with a circular orbit and a constant spin frequency within our sensitivity.
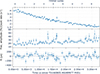 |
Fig. 2. Summary of the timing analysis for MAXI J1957+032 from the XMM-Newton/PN observation. Top: 0.5–10.0 keV background-subtracted count rate versus time for each time interval adopted to estimate a significant pulse profile. Middle: Fractional amplitude of the fundamental harmonic in each H-test-selected segment. 1σ errors are from the photon bootstrap. Bottom: Pulse-phase residuals relative to the best-fitting coherent timing model (Table 1). The dashed grey line marks zero residual. Time is measured from T0 = 60805.40289977 MJD (TDB), and the horizontal axis along the top shows the corresponding orbital phase over the observation. |
To quantify the pulse strength in each interval, we phase-aligned the events to the coherent solution. We fitted the mean-normalised binned profile with a harmonic model at the segment’s optimal order m★. We take the fundamental amplitude to be the fractional-interval amplitude and estimate its 1σ uncertainty via a photon bootstrap. The fractional amplitude increases gradually as the source flux declines (Fig. 2, middle panel), in agreement with the trend reported during the previous outburst (Sanna et al. 2022a) and commonly seen in AMXPs (e.g. Bult et al. 2019, 2022; Sanna et al. 2022b; Illiano et al. 2023; Ballocco et al. 2025). Higher harmonics are not individually significant at ≥3σ in the segment-wise Zk2 analysis, indicating that, on short timescales, the observed variability reflects an overall rescaling of a profile dominated by the fundamental rather than a substantial change in pulse shape.
Using the best-fitting ephemeris, we corrected the photon times and produced the average pulse profile. To maximise S/N, we scanned energy selections using an H-test-driven segmentation and adopted the 0.50 − 6.5 keV band as the optimal range. The mean-normalised profile is smooth and largely dominated by the fundamental harmonic (H1). An unbinned H-test returns mopt = 5, but only the first, second (H2), and fifth (H5) harmonics are individually significant, while the remaining components are consistent with zero. A weighted least-squares refit to the binned profile reproduces the morphology well, with the second harmonic accounting for the mild asymmetry of the waveform (see Fig. 3).
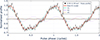 |
Fig. 3. Pulse profile of MAXI J1957+032 in the 0.50–6.5 keV band. Points (with 1σ errors) show the mean-normalised, 64-bin profile plotted over two cycles. The solid line is the weighted least-squares fit at the H-test-selected order (mopt = 5); dotted curves display the individually significant harmonic components (H1, H2, and H5). |
To characterise the energy dependence, we divided the spectrum into 16 significance-optimised bands between 0.5 and 10.0 keV (each exceeding a fixed σ selection threshold). In all bands, the signal is adequately described by a pure sinusoidal function (m★ = 1). From the best-fitting model, we measured the corresponding phase and fractional amplitude values. Fig. 4a shows for the pulse phase a significant soft-lag trend with energy: a linear model improves over a constant by Δχ2 = 10.12 for one d.o.f. (p = 1.5 × 10⁻³), with slope b = −0.0123 ± 0.0039 cycles keV−1 (relative to the reference band), and hints at a turnover above ∼3–4 keV where the errors increase. Figure 4b reveals that the fractional amplitude rises from ∼18–25% below 1 keV to ∼30–33% at 1.3–2.0 keV, then decreases above ∼3 keV to ∼16% at 4.5–7.5 keV. A linear trend does not provide a significant improvement over a constant (Δχ2 = 1.71 for one d.o.f., null-hypothesis probability p = 0.19), consistent with the non-monotonic shape.
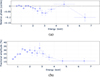 |
Fig. 4. Energy dependence of the pulsations in MAXI J1957+032. The XMM-Newton/PN dataset is split into 16 significance-optimised bands spanning 0.5–10.0 keV. In each band, the signal is modelled with a pure sinusoidal function (fundamental harmonic) at the NS spin period. Panel (a): Relative phase of the fundamental as a function of energy. Panel (b): Fractional amplitude of the fundamental as a function of energy. |
3.2. Spectral analysis
We performed the X-ray spectral analysis of XMM-Newton and Swift data using the X-ray spectral fitting package XSPEC (Arnaud 1996) version 12.14.1. We adopted the interstellar medium abundance and the cross-section tables from Wilms et al. (2000) and Verner et al. (1996), respectively. All uncertainties on spectral parameters are given at the 1σ confidence level.
3.2.1. XMM-Newton spectroscopy
We extracted the PN spectrum with a minimum of 25 counts in each channel. We limited the spectral analysis to the 0.5–8 keV band, as the background dominates outside this interval.
We first fit the spectrum with an absorbed power-law model (TBabs * powerlaw), which yielded a χ2 = 213.27 for 128 d.o.f. However, since AMXPs in outburst are typically described by thermally Comptonised emission (e.g. Di Salvo et al. 2023), we replaced the power-law component with the convolution model thcomp (Zdziarski et al. 2020) applied to a blackbody component (TBabs * (thcomp * bbodyrad); see the red spectrum in Fig. 5). Given the lack of spectral coverage above 10 keV, we fixed the electron temperature, kTe, to 30 keV, consistent with the range of values found during the 2022 outburst by Sanna et al. (2022a). This revised model significantly improved the fit, yielding a final χ2 = 141.24 for 126 d.o.f. (an improvement of Δχ2 ≃ 72 with two fewer free parameters compared to the power-law model). The resulting best-fit parameters are listed in Table 2. The unabsorbed 0.5–10 keV flux, F0.5 − 10, was estimated by including the cflux component. In the context of the full outburst evolution, the PN spectrum is consistent with the softening trend seen in the Swift/XRT data (Sect. 3.2.2), showing a relatively steep Comptonised continuum and a comparatively cool blackbody component, as commonly observed in AMXPs during outburst decay.
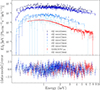 |
Fig. 5. Top: Unfolded average spectrum of the persistent emission from MAXI J1957+032. The blue curves represent Swift/XRT spectra, from the earliest observation (darkest blue) to the latest (lightest blue), fitted with the TBabs*powerlaw model (see Sect. 3.2.2). In the legend, Swift/XRT observations are labelled ‘SW’ followed by their Obs. ID (see Table A.1). The red curve shows the XMM-Newton/PN spectrum, fitted with TBabs*(thComp*bbodyrad) (see Sect. 3.2.1). Bottom: Residuals with respect to the adopted models. |
Best-fit spectral parameters from the model TBabs * (thComp*bbodyrad) for the XMM-Newton/PN spectrum.
Given that the reflection spectrum, especially the iron Kα complex, is commonly observed in AMXPs in outburst (see e.g. Table 3 from Illiano et al. 2024 and references therein), we searched for similar features in MAXI J1957+032 by adding Gaussian lines to our best-fit model. We fixed the other parameters to their previously obtained values. The line energies were set consecutively at 6.4 keV (neutral or lightly ionised Fe Kα), 6.7 keV (He-like Fe XXV), and 6.97 keV (H-like Fe XXVI). To account for possible reflection broadening, we adopted a Gaussian width of σ = 0.2 keV, slightly larger than the intrinsic spectral resolution of PN, and typical of Fe lines observed in reflection spectra of similar systems (e.g. Illiano et al. 2024 and references therein). No significant emission feature was found. We derived 3σ upper limits on the equivalent widths of each of these features at 6.4, 6.7, and 6.97 keV, which were ∼0.25, 0.29, and 0.23 keV, respectively.
3.2.2. Swift spectroscopy
We modelled the first Swift/XRT spectrum acquired in PC mode at the onset of the outburst (see Table A.1). An absorbed power-law model (TBabs * powerlaw) provided a good fit with a χ2 of 93.23 for 93 d.o.f. Motivated by the results obtained for the XMM-Newton/PN spectrum (Sect. 3.2.1), we also tested the TBabs * (thcomp * bbodyrad) model, fixing kTe to 30 keV and the NH to the value derived from the power-law model, since the other parameters were otherwise unconstrained. However, the fit did not provide meaningful constraints, with a blackbody normalisation consistent with zero within 2σ. For this reason, we adopted the simpler power-law model to describe all XRT spectra in order to track the spectral evolution throughout the outburst consistently (see the blue spectra in Fig. 5). The best-fit parameters are reported in Table A.2 and shown in Fig. 6. All spectral parameters are consistent within 1σ with those obtained with the online XRT product generator, except the NH value of Obs. ID 00033770035, which is consistent within 3σ. The last Swift/XRT observation analysed (Obs. ID 00033770040), which is the one closest in time to the XMM-Newton observation, shows a slight discrepancy in the spectral parameters compared to the PN spectrum (Fig. 6). However, both NH and Γ remain consistent with the PN values within 1.5σ, likely due to the large uncertainties associated with the low statistics of the Swift spectrum.
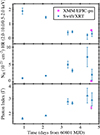 |
Fig. 6. Temporal evolution of the main spectral parameters describing the continuum emission of MAXI J1957+032 observed with Swift/XRT (blue points) and XMM-Newton/PN (pink points). Top: Hardness ratio HR = F2 − 10/F0.5 − 2. Middle: NH. Bottom: Photon index (Γ). All values are listed in Tables A.2 and 2. Error bars represent 1σ uncertainties. |
By including the cflux component, we estimated the X-ray unabsorbed flux in three bands: 0.5–10 keV flux (F0.5 − 10), 0.5–2 keV flux (F0.5 − 2; soft band), 2–10 keV flux (F2 − 10; hard band). From these quantities we computed, for each observation, the hardness ratio HR = F2 − 10/F0.5 − 2; the temporal evolution of HR, together with that of NH and Γ, is shown in Fig. 6. The hardness ratio shows a clear softening trend as the outburst decays, decreasing steadily at lower fluxes. This behaviour closely resembles the spectral evolution seen during the 2022 outburst and indicates a smooth spectral softening during the decay rather than a full hard-to-soft state transition.
3.3. Optical photometry
MAXI J1957+032 was clearly detected in all unblended LCO images obtained between May 8 and 11, 2025 (MJD 60803–60806). The calibrated magnitudes used here are listed in Appendix B. A joint X-ray/optical view of the 2025 outburst is shown in Fig. 1, where the Swift/XRT 0.5–10 keV light curve is plotted together with the LCO g′, r′, and i′ photometry. The source reached its maximum optical brightness on May 10, 2025 (MJD 60805; see also Illiano et al. 2025), after which it declined rapidly. Subsequent LCO observations on May 13 (MJD 60808.03) showed a blended magnitude of g′ = 20.30 ± 0.20, consistent with the nearby field star and indicating that the outburst had ended at optical wavelengths.
At its peak, the 2025 outburst did not reach the same brightness level as the first peak of the previous outburst on June 20, 2022 (MJD 59750; Baglio et al. 2022b,a, see also Fig. B.1), when MAXI J1957+032 reached g′ = 19.087 ± 0.016 mag, i′ = 18.943 ± 0.034 mag (the peak in r′ band was instead reached on MJD 59751, with r′ = 18.923 ± 0.086 mag). The optical evolution during the 2025 outburst does not appear to track the X-ray flux. While the optical flux increased slightly between MJD 60803 and MJD 60805, the 2–10 keV X-ray flux declined by more than an order of magnitude (a factor of ∼14; Table 2). This apparent anti-correlation suggests that X-ray reprocessing is unlikely to dominate the optical emission during this phase. Instead, the optical light may originate primarily from the intrinsic thermal emission of the outer accretion disc. Although no optical data are available before MJD 60803, it is possible that an earlier optical maximum occurred prior to our observing window. Indeed, Kong (2025) reported optical brightening of the source as early as May 5, 2025 (MJD 60800), preceding the first X-ray observations, although no magnitudes were provided. Taken together, these results indicate that the optical emission evolved independently of the X-rays, with the optical maximum likely occurring after substantial X-ray fading.
Figure 7 shows the nearly simultaneous optical spectral energy distributions (SEDs) of MAXI J1957+032 obtained between May 8 and May 11, 2025. The flux densities have been corrected for Galactic reddening using the dust_extinction Python package with extinction curves from Gordon (2024) (see also Gordon et al. 2009; Fitzpatrick et al. 2019; Gordon et al. 2021; Decleir et al. 2022), adopting a colour excess of E(B − V) = 0.034 ± 0.011 mag derived from the neutral hydrogen column density NH = (0.3 ± 0.1) × 1021 cm−2 and using the Foight et al. (2016) conversion (Table 2). This value corresponds to the lowest NH measured from the XMM-Newton spectrum, which is likely to represent the foreground absorption best; intrinsic variations in NH seen during the outburst are not expected to correlate with optical extinction (e.g. Oates et al. 2019). The SEDs indicate that the outburst reached its optical peak between MJD 60803.3 and MJD 60805, followed by a rapid decline thereafter. A clear colour evolution is also evident, with the i′-band flux decreasing more strongly between MJD 60805 and MJD 60806 than in the bluer bands.
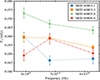 |
Fig. 7. SEDs of MAXI J1957+032 obtained from LCO observations between May 8 (MJD 60803) and May 11, 2025 (MJD 60806). Different colours and symbols correspond to the observation dates (MJDs 60803.1, 60803.3, 60805.0, and 60806.0), and the error bars indicate the propagated uncertainties, including both photometric and reddening contributions. |
4. Discussion and conclusions
We presented the temporal and spectral properties of the AMXP MAXI J1957+032 during its 2025 outburst by analysing the available XMM-Newton, Swift and optical datasets.
4.1. Timing analysis
We performed a phase-coherent timing analysis of MAXI J1957+032 during its 2025 flash outburst, showing that the source retained a remarkably stable rotational ephemeris over the XMM-Newton exposure. Within sensitivity, no spin-frequency derivative or orbital evolution is required, and the post-fit residuals display no persistent steps (Fig. 2). This behaviour contrasts with the 2022 NICER campaign, where a discrete, long-lived phase discontinuity appeared near MJD 59750.2 (Sanna et al. 2022a), and no analogous feature is required here. This suggests that phase irregularities in MAXI J1957+032 are sporadic manifestations of disc–magnetosphere instabilities that reconfigure the magnetospheric coupling and shift the accretion footprint, producing phase offsets and rapid profile changes (see e.g. Riggio et al. 2008; Patruno et al. 2009b,a; Kajava et al. 2011; Poutanen et al. 2009; Ibragimov & Poutanen 2009). A similar intermittency of phase irregularities has been reported in the prototypical AMXP SAX J1808.4−3658, where profile evolution and occasional phase jumps complicate torque measurements (see e.g. Burderi et al. 2006; Hartman et al. 2008). In the broader AMXP population, low-level timing noise often tracks the X-ray flux via phase–flux correlations, suggesting a connection with a hotspot in motion and a corresponding bias on apparent spin-frequency derivatives  (see e.g. Patruno et al. 2009b). The absence of a measurable
  here is therefore unsurprising, given both the short baseline and the near constancy of the phase residuals. Single-outburst torque estimates based on short-baseline timing should, in general, be interpreted with caution (see e.g. Hartman et al. 2008; Patruno et al. 2009b).
4.1.1. Pulse profile and energy dependence
On short timescales, the MAXI J1957+032 profiles are driven almost entirely by the fundamental component, and the segment-to-segment variability is well described by amplitude rescaling rather than genuine shape changes. The fractional amplitude gradually increases as the flux declines, mirroring the previous outburst and trends seen in other AMXPs, and suggesting that the emitting region becomes more localised as the accretion rate drops (see e.g. MAXI J1816-195, IGR J17379-3747, and IGR J17498-2921; Bult et al. 2019, 2022; Illiano et al. 2024). For MAXI J1957+032, the combination of (i) an essentially sinusoidal waveform, (ii) an amplitude–flux anti-correlation, and (iii) the reproducibility of the shape between 2022 and 2025 points to a stable visibility geometry for the hotspot and a relatively quiescent disc–magnetosphere coupling over the XMM-Newton interval.
By combining the whole dataset, we obtained the most significant average pulse profile in the optimal 0.50–6.5 keV band. The morphology reinforces this view of geometrical steadiness. A noteworthy feature of the average profile is the significant detection of the fifth harmonic, while the third and fourth remain undetected within tight upper limits. Rich harmonic content is not unprecedented among AMXPs, but this specific configuration is. In several systems higher-order harmonics have been detected, though usually with rapidly decreasing amplitudes: in IGR J17591−2342 the NICER profile required four components, but in energy-resolved profiles, only the fundamental and second harmonic remained significant (Sanna et al. 2020); SWIFT J1749.4−2807 showed harmonics up to third order, with the second harmonic even exceeding the fundamental, consistent with two nearly antipodal spots at high inclination (Sanna et al. 2022b); the ultra-compact IGR J16597−3704 also exhibited up to four harmonics in NuSTAR data (Sanna et al. 2018). These examples show that AMXP waveforms can carry power to high orders, but detectability is strongly controlled by geometry, anisotropy and S/N, providing a natural context for our case, where the fifth harmonic is detected while the third and fourth are not.
From a theoretical standpoint, Poutanen & Beloborodov (2006) showed that the Fourier content of the waveform is governed by (i) the number and geometry of emitting regions (primary and antipodal spots), (ii) beaming anisotropy (e.g. a Comptonising slab), and (iii) relativistic effects (Doppler boosting, aberration and light bending). In their analytic hotspot framework, specific harmonics can be strongly suppressed for plausible viewing geometries and anisotropy; in particular, anisotropy naturally enhances the second harmonic, while time-delay effects generate a small third harmonic. Complementary calculations by Viironen & Poutanen (2004) show how a Comptonising slab can imprint narrow phase substructure whose power is distributed into higher orders, with a mild energy dependence.
In this context, two scenarios could qualitatively reproduce our findings. In a ‘two-spot interference’ picture, two nearly antipodal spots with similar brightness partly cancel odd harmonics; small departures from perfect antipodality and modest asymmetries in intensity or longitude can shift the cancellation so that the third and fourth harmonics lie near minima, while a residual fifth harmonic remains above our sensitivity. Alternatively, an ‘anisotropic beaming’ scenario invokes a weak, phase-confined excess from a Comptonising layer (e.g. an accretion shock just above the hotspot) that seeds higher-order terms without lifting all orders equally (Viironen & Poutanen 2004). The resulting phase-localised anisotropy provides a natural mechanism to enhance specific higher-order harmonics while maintaining minima at intermediate orders (Poutanen & Beloborodov 2006).
While these scenarios allow the selective suppression of specific harmonics, the precise pattern observed here is uncommon for AMXPs, so our interpretation remains provisional. A more secure conclusion will require higher photon statistics and source-specific relativistic two-spot modelling (e.g. allowing small offsets in spot longitudes and brightness and an explicit anisotropy parameter), together with harmonic-by-harmonic tests (e.g. stability of the fifth-harmonic phase and tighter upper limits on the lower components).
The pulse shape of MAXI J1957+032 remains essentially sinusoidal at all energies, with variability dominated by the fundamental and only weak higher-order structure. The fractional amplitude increases as the outburst fades and, within each dataset, shows the familiar mild rise with photon energy before flattening, a behaviour seen in several AMXPs and usually attributed to the changing mix of a hard Comptonised component and a softer thermal contribution from the hotspot and/or disc. A similar amplitude–energy trend (rise to a few keV, then plateau or mild decline) together with soft lags that grow with energy has been observed in other AMXPs. NICER observations of IGR J17591−2342, for example, showed a pattern well reproduced by down-scattering of hard photons in relatively calm plasma near the surface or disc (see Fig. 4 and the discussion in Sanna et al. 2020). Our energy-resolved timing analysis is consistent with the standard hotspot plus Comptonisation picture developed for AMXPs: a hard, mildly anisotropic Comptonised beam leads in phase and sets the amplitude–energy rise, while a softer component lags due to reprocessing or scattering (see e.g. Cui et al. 1998; Poutanen & Gierliński 2003; Falanga & Titarchuk 2007). The close similarity between the 2025 behaviour and the 2022 outburst (excluding the phase-jump interval) argues for a stable viewing geometry and magnetospheric coupling across events.
4.1.2. Long-term spin evolution
By adopting the spin frequency obtained from the coherent 2022 timing solution reported by Sanna et al. (2022a) on Table 1 (ν22 = 313.64374049(22) Hz at T0 = 59749.0 MJD (TDB)), and comparing it with the 2025 XMM-Newton timing solution (ν25 = 313.64373844(34) Hz at T0 = 60805.4 MJD (TDB)), we find a small but significant spin-down over the Δt ≃ 1056 d between the two epochs. The frequency offset is
 (1)
(1)
corresponding to an average spin derivative of
 (2)
(2)
The magnitude of  is about an order of magnitude larger (in absolute value) than the secular spin-down reported for sources such as SAX J1808.4-3658 (
 ; Illiano et al. 2023), IGR J00291+5934 (
 ; Patruno 2010; Papitto et al. 2011), XTE J1751-305 (
 ; Riggio et al. 2011), IGR J17498-2921 (
 ; Illiano et al. 2024), and IGR J17511-3057 (
 ; Sanna et al. 2025), but comparable to what has been reported for the AMXP IGR J17494-3030 (
 ; Ng et al. 2021).
The 2022 NICER timing analysis revealed a ∼0.2 cycle phase jump during the outburst (Sanna et al. 2022a), which was modelled through a phase step in their coherent solution. The single-spin frequency reported in their Table 1 likely corresponds to the most stable portion of the signal after that discontinuity and is therefore adopted here as the reference value for the long-term comparison. Given the occurrence of phase jumps, the derived frequency and, hence, the inferred spin-down derivative should be treated with caution and verified through future monitoring across multiple outbursts.
Even with this limitation, the observed spin-frequency derivative offers a means to quantify the torque acting on the NS and to compare it with values measured in other AMXPs. From the long-term spin derivative derived, we can estimate the braking torque on the star following from angular-momentum conservation
 (3)
(3)
where I is the NS moment of inertia. Adopting a canonical I = 1045 g cm2 and the observed  , we infer
 (4)
(4)
If we interpret the secular  as dominated by magnetic-dipole braking during quiescence, the polar dipole field (Bp) can be estimated from the free-force dipole torque (orthogonal rotator Spitkovsky 2006):
 (5)
(5)
which gives the standard frequency-space relation
 (6)
(6)
and hence
![Mathematical equation: $$ \begin{aligned} B_{\rm p}\;=\;\left[\frac{I\,c^{3}\,|\dot{\nu }|}{\pi ^{2}R^{6}\nu ^{3}\,(1+\sin ^{2}\!\alpha )}\right]^{1/2}\;, \end{aligned} $$](/articles/aa/full_html/2026/02/aa57859-25/aa57859-25-eq24.gif) (7)
(7)
where α is the magnetic obliquity (angle between the rotation and magnetic axes). With R ≈ 10 km and α = 90°, this gives a characteristic field of order Bp ≲ 1 × 10⁹ G. We stress that this dipole estimate should be regarded as an upper limit, since part of the measured secular spin-down may be produced by residual disc torques or timing-noise/phase–flux systematics rather than pure dipole braking (see e.g. phase-flux bias discussion; Patruno et al. 2009b). The surface dipolar field inferred for MAXI J1957+032 is consistent with that reported for other AMXPs (Mukherjee et al. 2015).
4.2. Spectral properties
AMXPs typically exhibit hard X-ray spectra during their outbursts, usually without showing transitions to softer states (see e.g. Poutanen 2006; Di Salvo et al. 2023, and references therein). The spectral shape is often characterised by a power-law emission, with photon indices commonly in the range Γ ∼ 1.8 − 2.0. This hard X-ray emission is usually attributed to thermal Comptonisation processes, where seed blackbody-like photons with a temperature of ∼0.3–1.0 keV are up-scattered by hot electrons at temperatures of ∼20–50 keV (see e.g. Papitto et al. 2020). Notably, AMXPs tend to display reduced spectral variability during outbursts when compared to non-pulsating NS in LMXBs (e.g. Illiano et al. 2024; Li et al. 2024; Manca et al. 2023; Marino et al. 2022).
In our analysis, the XMM-Newton/PN spectrum of MAXI J1957+032 was well fitted using a thermal Comptonisation model (thcomp) convolved with a blackbody component, in line with findings from the 2022 outburst (Sanna et al. 2022a). Adopting a distance of 5 kpc (Ravi 2017), we derived a blackbody normalisation corresponding to a radius of  km, consistent with emission from a localised region such as a hotspot on the NS surface, as previously reported.
Unlike the majority of AMXPs, which typically exhibit persistently hard X-ray spectra throughout their outbursts as mentioned above, MAXI J1957+032 showed a marked spectral softening during its 2025 event, despite the outburst lasting only about five days. This was evident in the evolution of the HR, which dropped from ∼2 at the onset to ∼0.2 in the decay phase (see the top panel of Fig. 6), and in the progressive increase in the photon index from ∼1.7 to values approaching 3 (bottom panel of Fig. 6 and Table A.2). This spectral softening closely mirrors the behaviour observed during the 2022 outburst, when Sanna et al. (2022a) reported a photon index reaching up to ∼2.8 during the decay phase (see also Beri et al. 2019; Wijnands et al. 2015; Manca et al. 2023). Although MAXI J1957+032 reaches luminosities higher than those of canonical VFXTs, during most of the decay it traverses the LX ∼ 1034–1036 erg s−1 range where NS VFXTs are known to soften. The increase in the photon index from ∼1.7 to ∼3 is fully compatible with the LX-Γ behaviour observed in these systems (see e.g. Wijnands et al. 2015).
We also observed variability in the column density (NH) throughout the outburst (middle panel of Fig. 6), consistent with the behaviour seen in previous episodes. The NH values obtained from the Swift/XRT spectra are systematically higher than those derived from the XMM-Newton/EPIC data, likely because the simple power-law model used for Swift does not capture the intrinsic low-energy curvature accounted for by the thcomp*bbodyrad model adopted for XMM-Newton. Finally, no disc reflection features were detected in the spectra, again in line with the results reported for the 2022 outburst (Sanna et al. 2022a). Reflection signatures have been observed in many AMXPs (see e.g. Table 3 in Illiano et al. 2024); however, several systems, like MAXI J1957+032, show no clear evidence of such components (e.g. Falanga et al. 2005; Sanna et al. 2018). The lack of detectable Fe K emission may be because the emitting region is small and illuminated by a concentrated X-ray flux from the hotspot or accretion column, leading to a very high ionisation that prevents the formation of discrete lines (see e.g. Ross & Fabian 2005).
Recently, coherent X-ray pulsations have been detected from the two AMXPs IGR J17511−3057 and IGR J17379−3747 at very low luminosities, L0.5 − 10 keV ≲ afew × 1033 erg s−1, close to the typical threshold for the onset of the propeller regime (Illiano et al. 2026; Bult et al. 2019). In both systems, the unusually high pulse amplitudes, most likely due to favourable viewing geometries, allowed the detection of pulsations even beyond the expected accretion-propeller transition. Given the relatively large pulse fraction observed in MAXI J1957+032 (see Sect. 3.1), we explored whether accretion onto the NS in this system could also be taking place near, or perhaps just beyond, the propeller boundary.
Using the flux reported in Table 2, we estimate that during the XMM-Newton observation the source reached a 0.5 − 10 keV luminosity of ∼2 × 1034 erg s−1 for an assumed distance of 5 kpc. In accreting pulsars, accretion-powered pulsations can be sustained only if the magnetospheric truncation radius lies within the co-rotation radius, where the Keplerian frequency of the disc equals the stellar spin. The co-rotation radius is defined as ![Mathematical equation: $ {R_\mathrm{{co}}} = [G M_{\mathrm{ns}}/(2 \pi \nu)^2]^{1/3} \simeq 1.68 \times 10^{6} \,{M_{1.4}} \, {P_\mathrm{{ms}}}^{2/3} \, \mathrm{cm} $](/articles/aa/full_html/2026/02/aa57859-25/aa57859-25-eq26.gif) , where M1.4 is the NS mass (Mns) in units of 1.4 M⊙ and Pms is the spin period in milliseconds. For a 1.4 M⊙ NS spinning at Pms ≃ 3.2, this gives Rco ≈ 36 km. To infer the mass accretion rate at the epoch of the XMM-Newton observation, we extrapolated the unabsorbed 0.5 − 10 keV flux to the 0.1 − 100 keV band, obtaining FX = (7.4 ± 0.2)×10−12 erg cm−2 s−1. The corresponding accretion rate is Ṁ = 4 π d2 FX Rns/(GMns) ≃ 1 × 10¹⁴ g s−1 for a 1.4 M⊙ NS with a Rns = 10 km radius. The magnetospheric (or truncation) radius, Rm, can be expressed as a fraction, ξ, of the Alfvén radius (e.g. Ghosh & Lamb 1979a):
, where M1.4 is the NS mass (Mns) in units of 1.4 M⊙ and Pms is the spin period in milliseconds. For a 1.4 M⊙ NS spinning at Pms ≃ 3.2, this gives Rco ≈ 36 km. To infer the mass accretion rate at the epoch of the XMM-Newton observation, we extrapolated the unabsorbed 0.5 − 10 keV flux to the 0.1 − 100 keV band, obtaining FX = (7.4 ± 0.2)×10−12 erg cm−2 s−1. The corresponding accretion rate is Ṁ = 4 π d2 FX Rns/(GMns) ≃ 1 × 10¹⁴ g s−1 for a 1.4 M⊙ NS with a Rns = 10 km radius. The magnetospheric (or truncation) radius, Rm, can be expressed as a fraction, ξ, of the Alfvén radius (e.g. Ghosh & Lamb 1979a):
![Mathematical equation: $$ \begin{aligned} R_{\mathrm{m} } = \xi \left[ \frac{(B_{\mathrm{s} } R_{\mathrm{ns} }^3)^4}{(2 G M_{\mathrm{ns} } \dot{M}^2)} \right]^{1/7}, \end{aligned} $$](/articles/aa/full_html/2026/02/aa57859-25/aa57859-25-eq27.gif) (8)
(8)
where Bs is the NS surface magnetic field, and G is the gravitational constant. Requiring Rm < Rco for accretion to occur, we derived an upper limit on the magnetic field strength:
 (9)
(9)
where kbol represents the bolometric correction applied to FX. Adopting M = 1.4 M⊙, R = 10 km, and ξ = 0.5 yields Bp ≈ 9 × 10⁷ G. Including the distance uncertainty d = (5 ± 2) kpc (Ravi 2017) gives Bp ≈ (5.4 × 10⁷ − 1.3 × 10⁸) G for ξ = 0.5. Allowing for the typical ξ range, 0.3–0.5 (see e.g. Burderi et al. 1998; Kulkarni & Romanova 2013; Bozzo et al. 2018; Campana et al. 2018, for more discussion on the parameter) increases the limit by a factor of (0.5/0.3)1.75 ≃ 2.44 at ξ = 0.3, corresponding to Bp ≈ 2.2 × 10⁸ G, and up to ∼3 × 10⁸ G at 7 kpc. Conservatively, we therefore estimate the magnetic field in the range Bp ≈ (0.5 − 3)×108 G for d = 5 ± 2 kpc, and ξ = [0.3 − 0.5].
It is worth noticing that this truncation-based bound is not consistent (smaller by a factor of ∼3–10) with the independent estimate from the secular spin-down, which yields an upper limit on the polar dipole field of order Bp ≲ 109 G if interpreted with a force-free torque law. Even adopting the most favourable geometry (i.e. a nearly aligned rotator, α = 0°), which increases the inferred dipole field by only a factor of  , the value derived from the secular spin-down remains significantly higher than the truncation-based estimate. A possible way to reconcile the phenomenology is to relax the hard-barrier assumption at co-rotation: if accretion can persist in a mildly leaky propeller with Rm ≳ Rco, the truncation argument underestimates the true field (see e.g. the trapped-disc/weak-propeller framework of D’Angelo & Spruit 2012; Arnason et al. 2015).
A similar phenomenology has recently been reported for the high-field Be and X-ray binary A 0538–66, where NICER detected low-level pulsations at very low luminosity (Ducci & Mereghetti 2025). In that system, a partially open or ‘leaky’ propeller was invoked to reconcile the magnetic field inferred from spin evolution with that required to allow residual accretion. Although A 0538–66 is a high-field X-ray pulsar and therefore operates in a very different regime from MAXI J1957+032, the idea that some inflowing matter can still cross Rm ≳ Rco provides a useful parallel, supporting the plausibility of a mildly leaky propeller also in this source.
An alternative (not mutually exclusive) possibility is that the secular  still carries a contribution from residual disc torques and/or phase–flux systematics, biasing the dipole estimate high. Longer time-baselines with additional outbursts will help firm up the true long-term trend.
4.3. Optical versus X-ray emission
The optical emission in outbursting X-ray binaries empirically correlates with the X-ray luminosity, with distinct normalisations for NSs and black holes: at a given LX, black holes are typically ∼an order of magnitude brighter in the optical/IR than NSs, and the global relation often follows LOIR ∝ LX β with β ≈ 0.5–0.7, depending on band and accretion state (Russell et al. 2006, 2007). Using our de-reddened g′ photometry (the same is also obtained using the i′ band one), matched to the nearest X-ray fluxes (Swift/XRT; XMM-Newton for the final epoch), we place MAXI J1957+032 on the LOIR–LX diagram (Fig. 8).
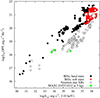 |
Fig. 8. Optical luminosity (de-reddened νLν in g′) versus X-ray luminosity (0.5–10 keV) for MAXI J1957+032. Black points and red diamonds show black-hole X-ray binaries in the hard and soft state, respectively; open circles represent NS systems (Russell et al. 2006, 2007). |
The source lies within the NS region, i.e. ∼1 order of magnitude below the black-hole track at comparable LX. We note that the correlation for MAXI J1957+032 is not strictly positive throughout the campaign, which may be due to the source undergoing a state transition. Such transitions can modify the reprocessing geometry and jet contribution, thereby altering the OIR and X-ray coupling (e.g. Russell et al. 2006).
Figure 7 shows that the SED on MJD 60805 is the brightest, consistent with the optical light curves in Fig. 1, indicating that the optical peak likely occurred between MJD 60803.3 and MJD 60805. The overall shapes are broadly consistent with irradiation-dominated disc emission (approximately flat to mildly red in Fν) as expected when X-ray reprocessing sets the optical output.
Interestingly, only the first SED (MJD 60803.1) shows an apparent excess at the longest wavelength, with the i′-band flux lying above the extrapolation from the bluer bands. This epoch coincides with the hardest X-ray spectrum (Fig. 6), suggesting that the red excess could trace a contribution from a compact jet. In both black hole and NS transients, compact, continuously launched jets are characteristic of the hard accretion state and are quenched as the source softens (e.g. Coriat et al. 2009; Baglio et al. 2018; Saikia et al. 2019). The evolution of the SEDs in MAXI J1957+032, from a relatively red first epoch to subsequently bluer spectra, is consistent with this picture, with the jet contribution fading as the X-rays soften.
Among NS X-ray binaries, AMXPs are particularly prone to showing red or near-infrared excesses attributed to synchrotron emission from jets. This is likely due to their short orbital periods and relatively small accretion discs, which reduce the dominance of the thermal disc component, as well as their tendency to remain in hard states. Red excesses consistent with jet synchrotron emission have been reported in several AMXPs, including SAX J1808.4−3658 (Wang et al. 2001; Baglio et al. 2020), IGR J00291+5934 (Lewis et al. 2010), XTE J0929−314 (Giles et al. 2005), and XTE J1814−338 (Krauss et al. 2005; Baglio et al. 2013), among others. The red excess seen in MAXI J1957+032 during the first epoch may therefore represent a similar jet-related component.
Only upper limits are currently available in the radio band. The deepest one, from MeerKAT (van den Eijnden et al. 2022), corresponds to a radio luminosity of order a few ×1027 erg s−1 (for d = 5 kpc). This is comparable to, or below, the faintest radio detections of compact jets in AMXPs such as SAX J1808.4−3658 and IGR J00291+5934, and therefore does not place strong constraints on the presence of a weak jet in MAXI J1957+032. The tentative red excess we observe lies at the low end of the range of jet contributions inferred in those systems, but remains fully consistent with a relatively faint compact jet.
Since reprocessing implies that optical photons arise from an extended region (likely the outer accretion disc), small X-ray/optical lags of order the light-travel time across the disc are expected. Delays of a few to several tens of seconds have indeed been measured in LMXBs hosting both NSs and black holes, and are interpreted as reprocessing signatures in the outer flow or on the donor star surface (see e.g. O’Brien et al. 2002; Muñoz-Darias et al. 2007; Gandhi et al. 2010; Shahbaz et al. 2023). High-time-resolution optical monitoring, simultaneous with X-ray coverage, could reveal similar delays in MAXI J1957+032, thereby constraining the size, geometry, and irradiation response of its disc.
The optical SEDs in Fig. 7 (excluding the possible jet contribution in the first epoch) are roughly flat or slightly rising with frequency, consistent with emission from the outer disc. In standard disc models, such a shape is expected when part of the optical light is produced by the disc’s intrinsic thermal emission rather than purely by reprocessed X-rays. An optical brightening preceding the X-ray rise in the 2022 outburst (Wang et al. 2022) suggests that the outer disc starts heating before the inner regions become X-ray bright. A plausible explanation for the delayed optical peak in the 2025 outburst is that, as the heating front propagates outwards and the outer disc expands (e.g. Dubus et al. 2001), the emitting area grows, and the optical flux can continue to increase even while the X-rays already decay. Given the exceptionally short duration of this outburst, the disc expansion timescale may exceed the rapid X-ray decay timescale, naturally producing the observed delay. This sequence is qualitatively consistent with the thermal–viscous disc-instability framework commonly applied to transient systems (see e.g. Lasota 2001; Russell et al. 2019; Goodwin et al. 2020).
Acknowledgments
We gratefully acknowledge Dan Bramich for his contributions to XB-NEWS and for helpful discussions. This work uses observations from the Las Cumbres Observatory Global Telescope Network. This work received financial support from INAF through the GRAWITA 2022 Large Program Grant. A.B. acknowledges support through the European Space Agency (ESA) research fellowship programme. AM is supported by the National Spanish grant PGC2018-095512-BI00 (PI: Coti Zelati). This work was also partially supported by the program Unidad de Excelencia Maria de Maeztu CEX2020-001058-M. AP acknowledges support by INAF (Research Grant FANS and PULSE-X, PI: Papitto), the Italian Ministry of University and Research (PRIN MUR 2020, Grant 2020BRP57Z, GEMS, PI: Astone), and Fondazione Cariplo/Cassa Depositi e Prestiti (Grant 2023-2560, PI: Papitto).
References
- Alpar, M. A., Cheng, A. F., Ruderman, M. A., & Shaham, J. 1982, Nature, 300, 728 [NASA ADS] [CrossRef] [Google Scholar]
- Arnason, R. M., Sivakoff, G. R., Heinke, C. O., Cohn, H. N., & Lugger, P. M. 2015, ApJ, 807, 52 [Google Scholar]
- Arnaud, K. A. 1996, in Astronomical Data Analysis Software and Systems V, eds. G. H. Jacoby, & J. Barnes, ASP Con. Ser., 101, 17 [NASA ADS] [Google Scholar]
- Baglio, M. C., D’Avanzo, P., Muñoz-Darias, T., Breton, R. P., & Campana, S. 2013, A&A, 559, A42 [NASA ADS] [CrossRef] [EDP Sciences] [Google Scholar]
- Baglio, M. C., Russell, D. M., Casella, P., et al. 2018, ApJ, 867, 114 [NASA ADS] [CrossRef] [Google Scholar]
- Baglio, M. C., Russell, D. M., Crespi, S., et al. 2020, ApJ, 905, 87 [NASA ADS] [CrossRef] [Google Scholar]
- Baglio, M. C., Russell, D. M., Alabarta, K., Saikia, P., & Lewis, F. 2022a, ATel, 15466, 1 [Google Scholar]
- Baglio, M. C., Russell, D. M., Alabarta, K., Saikia, P., & Lewis, F. 2022b, ATel, 15448, 1 [Google Scholar]
- Ballocco, C., Papitto, A., Miraval Zanon, A., et al. 2025, A&A, in press, https://doi.org/10.1051/0004-6361/202556075 [Google Scholar]
- Beri, A., Altamirano, D., Wijnands, R., et al. 2019, MNRAS, 486, 1620 [Google Scholar]
- Bertin, E., & Arnouts, S. 1996, A&AS, 117, 393 [NASA ADS] [CrossRef] [EDP Sciences] [Google Scholar]
- Bozzo, E., Ascenzi, S., Ducci, L., et al. 2018, A&A, 617, A126 [NASA ADS] [EDP Sciences] [Google Scholar]
- Bramich, D. M., & Freudling, W. 2012, MNRAS, 424, 1584 [CrossRef] [Google Scholar]
- Buccheri, R., Fry, W. F., & Maccarone, M. C. 1993, A&A, 277, 353 [Google Scholar]
- Bult, P., Markwardt, C. B., Altamirano, D., et al. 2019, ApJ, 877, 70 [Google Scholar]
- Bult, P., Altamirano, D., Arzoumanian, Z., et al. 2022, ApJ, 935, L32 [NASA ADS] [CrossRef] [Google Scholar]
- Burderi, L., & King, A. R. 1998, ApJ, 505, L135 [Google Scholar]
- Burderi, L., Di Salvo, T., Robba, N. R., et al. 1998, ApJ, 498, 831 [Google Scholar]
- Burderi, L., Di Salvo, T., Menna, M. T., Riggio, A., & Papitto, A. 2006, ApJ, 653, L133 [NASA ADS] [CrossRef] [Google Scholar]
- Burderi, L., Di Salvo, T., Lavagetto, G., et al. 2007, ApJ, 657, 961 [NASA ADS] [CrossRef] [Google Scholar]
- Burrows, D. N., Hill, J. E., Nousek, J. A., et al. 2005, Space Sci. Rev., 120, 165 [Google Scholar]
- Campana, S., & Di Salvo, T. 2018, Accreting Pulsars: Mixing-up Accretion Phases in Transitional Systems, in The Physics and Astrophysics of Neutron Stars (Springer) [Google Scholar]
- Campana, S., Stella, L., Mereghetti, S., & de Martino, D. 2018, A&A, 610, A46 [NASA ADS] [CrossRef] [EDP Sciences] [Google Scholar]
- Chakrabarty, D., Jonker, P. G., & Markwardt, C. B. 2016, ATel, 9591, 1 [NASA ADS] [Google Scholar]
- Chambers, K. C., Magnier, E. A., Metcalfe, N., et al. 2016, arXiv e-prints [arXiv:1612.05560] [Google Scholar]
- Coriat, M., Corbel, S., Buxton, M. M., et al. 2009, MNRAS, 400, 123 [Google Scholar]
- Cui, W., Morgan, E. H., & Titarchuk, L. G. 1998, ApJ, 504, L27 [Google Scholar]
- D’Angelo, C. R., & Spruit, H. C. 2012, MNRAS, 420, 416 [Google Scholar]
- de Jager, O. C., & Büsching, I. 2010, A&A, 517, L9 [NASA ADS] [CrossRef] [EDP Sciences] [Google Scholar]
- de Jager, O. C., Raubenheimer, B. C., & Swanepoel, J. W. H. 1989, A&A, 221, 180 [NASA ADS] [Google Scholar]
- Decleir, M., Gordon, K. D., Andrews, J. E., et al. 2022, ApJ, 930, 15 [NASA ADS] [CrossRef] [Google Scholar]
- Di Salvo, T., & Sanna, A. 2020, arXiv e-prints [arXiv:2010.09005] [Google Scholar]
- Di Salvo, T., Papitto, A., Marino, A., Iaria, R., & Burderi, L. 2023, in HXGA, ed. C. Bambi, 147 [Google Scholar]
- Dubus, G., Hameury, J.-M., & Lasota, J.-P. 2001, A&A, 373, 251 [NASA ADS] [CrossRef] [EDP Sciences] [Google Scholar]
- Ducci, L., & Mereghetti, S. 2025, ApJ, 989, 150 [Google Scholar]
- Falanga, M., & Titarchuk, L. 2007, ApJ, 661, 1084 [NASA ADS] [CrossRef] [Google Scholar]
- Falanga, M., Bonnet-Bidaud, J. M., Poutanen, J., et al. 2005, A&A, 436, 647 [NASA ADS] [CrossRef] [EDP Sciences] [Google Scholar]
- Finger, M. H., Bildsten, L., Chakrabarty, D., et al. 1999, ApJ, 517, 449 [NASA ADS] [CrossRef] [Google Scholar]
- Fitzpatrick, E. L., Massa, D., Gordon, K. D., Bohlin, R., & Clayton, G. C. 2019, ApJ, 886, 108 [Google Scholar]
- Foight, D. R., Güver, T., Özel, F., & Slane, P. O. 2016, ApJ, 826, 66 [Google Scholar]
- Frank, J., King, A. R., & Raine, D. J. 2002, Accretion Power in Astrophysics, 3rd edn. (Cambridge University Press) [Google Scholar]
- Gandhi, P., Dhillon, V. S., Durant, M., et al. 2010, MNRAS, 407, 2166 [NASA ADS] [CrossRef] [Google Scholar]
- Gehrels, N., Chincarini, G., Giommi, P., et al. 2004, ApJ, 611, 1005 [Google Scholar]
- Ghosh, P., & Lamb, F. K. 1979a, ApJ, 232, 259 [Google Scholar]
- Ghosh, P., & Lamb, F. K. 1979b, ApJ, 234, 296 [Google Scholar]
- Giles, A. B., Greenhill, J. G., Hill, K. M., & Sanders, E. 2005, MNRAS, 361, 1180 [NASA ADS] [CrossRef] [Google Scholar]
- Goodwin, A. J., Russell, D. M., Galloway, D. K., et al. 2020, MNRAS, 498, 3429 [NASA ADS] [CrossRef] [Google Scholar]
- Gordon, K. D. 2024, JOSS, 9, 7023 [Google Scholar]
- Gordon, K. D., Cartledge, S., & Clayton, G. C. 2009, ApJ, 705, 1320 [NASA ADS] [CrossRef] [Google Scholar]
- Gordon, K. D., Misselt, K. A., Bouwman, J., et al. 2021, ApJ, 916, 33 [NASA ADS] [CrossRef] [Google Scholar]
- Hameury, J. M. 2020, ASR, 66, 1004 [Google Scholar]
- Hameury, J. M., & Lasota, J. P. 2016, A&A, 594, A87 [NASA ADS] [CrossRef] [EDP Sciences] [Google Scholar]
- Hartman, J. M., Patruno, A., Chakrabarty, D., et al. 2008, ApJ, 675, 1468 [NASA ADS] [CrossRef] [Google Scholar]
- Heinke, C. O., Zheng, J., Maccarone, T. J., et al. 2025, ApJS, 279, 57 [Google Scholar]
- Henden, A. A., Levine, S., Terrell, D., et al. 2018, AAS, 232, 223.06 [Google Scholar]
- Hynes, R. I. 2005, in The Astrophysics of Cataclysmic Variables and Related Objects, eds. J. M. Hameury, & J. P. Lasota, ASP Conf. Ser., 330, 237 [Google Scholar]
- Ibragimov, A., & Poutanen, J. 2009, MNRAS, 400, 492 [CrossRef] [Google Scholar]
- Illiano, G., Papitto, A., Sanna, A., et al. 2023, ApJ, 942, L40 [NASA ADS] [CrossRef] [Google Scholar]
- Illiano, G., Papitto, A., Marino, A., et al. 2024, A&A, 691, A189 [NASA ADS] [CrossRef] [EDP Sciences] [Google Scholar]
- Illiano, G., Papitto, A., Marino, A., et al. 2025, ATel, 17187, 1 [Google Scholar]
- Illiano, G., Papitto, A., Campana, S., et al. 2026, A&A, 706, A52 [NASA ADS] [CrossRef] [EDP Sciences] [Google Scholar]
- Jansen, F., Lumb, D., Altieri, B., et al. 2001, A&A, 365, L1 [NASA ADS] [CrossRef] [EDP Sciences] [Google Scholar]
- Kajava, J. J. E., Ibragimov, A., Annala, M., Patruno, A., & Poutanen, J. 2011, MNRAS, 417, 1454 [NASA ADS] [CrossRef] [Google Scholar]
- King, A. R. 1998, MNRAS, 296, L45 [Google Scholar]
- Kong, A. K. H. 2025, ATel, 17171, 1 [Google Scholar]
- Krauss, M. I., Wang, Z., Dullighan, A., et al. 2005, ApJ, 627, 910 [Google Scholar]
- Kulkarni, A. K., & Romanova, M. M. 2013, MNRAS, 433, 3048 [NASA ADS] [CrossRef] [Google Scholar]
- Lasota, J. 2001, New Astron. Rev., 45, 449 [Google Scholar]
- Lewis, F., Russell, D. M., Fender, R. P., Roche, P., & Clark, J. S. 2008, arXiv e-prints [arXiv:0811.2336] [Google Scholar]
- Lewis, F., Russell, D. M., Jonker, P. G., et al. 2010, A&A, 517, A72 [NASA ADS] [CrossRef] [EDP Sciences] [Google Scholar]
- Li, Z. S., Kuiper, L., Pan, Y. Y., et al. 2024, A&A, 691, A92 [NASA ADS] [CrossRef] [EDP Sciences] [Google Scholar]
- Li, Z., Kuiper, L., Pan, Y. Y., et al. 2025, ATel, 17279, 1 [Google Scholar]
- Lin, J., Yan, Z., Han, Z., & Yu, W. 2019, ApJ, 870, 126 [Google Scholar]
- Manca, A., Sanna, A., Marino, A., et al. 2023, MNRAS, 526, 1154 [NASA ADS] [CrossRef] [Google Scholar]
- Marino, A., Di Salvo, T., Burderi, L., et al. 2019, A&A, 627, A125 [NASA ADS] [CrossRef] [EDP Sciences] [Google Scholar]
- Marino, A., Anitra, A., Mazzola, S. M., et al. 2022, MNRAS, 515, 3838 [CrossRef] [Google Scholar]
- Mata Sánchez, D., Charles, P. A., Armas Padilla, M., et al. 2017, MNRAS, 468, 564 [Google Scholar]
- Meyer, F., & Meyer-Hofmeister, E. 1981, A&A, 104, L10 [NASA ADS] [Google Scholar]
- Mukherjee, D., Bult, P., van der Klis, M., & Bhattacharya, D. 2015, MNRAS, 452, 3994 [NASA ADS] [CrossRef] [Google Scholar]
- Muñoz-Darias, T., Martínez-Pais, I. G., Casares, J., et al. 2007, MNRAS, 379, 1637 [Google Scholar]
- Negoro, H., Serino, M., Mihara, T., et al. 2015, ATel, 7504, 1 [Google Scholar]
- Negoro, H., Nakajima, M., Takagi, K., et al. 2025, ATel, 17170, 1 [Google Scholar]
- Ng, M., Ray, P. S., Bult, P., et al. 2021, ApJ, 908, L15 [NASA ADS] [CrossRef] [Google Scholar]
- Ng, M., Bult, P. M., Gendreau, K. C., et al. 2022, ATel, 15444, 1 [Google Scholar]
- Oates, S. R., Motta, S., Beardmore, A. P., et al. 2019, MNRAS, 488, 4843 [Google Scholar]
- O’Brien, K., Horne, K., Hynes, R. I., et al. 2002, MNRAS, 334, 426 [Google Scholar]
- Papitto, A., Riggio, A., Burderi, L., et al. 2011, A&A, 528, A55 [NASA ADS] [CrossRef] [EDP Sciences] [Google Scholar]
- Papitto, A., Falanga, M., Hermsen, W., et al. 2020, New Astron. Rev., 91, 101544 [Google Scholar]
- Patruno, A. 2010, ApJ, 722, 909 [NASA ADS] [CrossRef] [Google Scholar]
- Patruno, A., & Watts, A. L. 2021, ASSL, 461, 143 [NASA ADS] [Google Scholar]
- Patruno, A., Watts, A., Klein Wolt, M., Wijnands, R., & van der Klis, M. 2009a, ApJ, 707, 1296 [Google Scholar]
- Patruno, A., Wijnands, R., & van der Klis, M. 2009b, ApJ, 698, L60 [NASA ADS] [CrossRef] [Google Scholar]
- Poutanen, J. 2006, ASR, 38, 2697 [Google Scholar]
- Poutanen, J., & Beloborodov, A. M. 2006, MNRAS, 373, 836 [NASA ADS] [CrossRef] [Google Scholar]
- Poutanen, J., & Gierliński, M. 2003, MNRAS, 343, 1301 [NASA ADS] [CrossRef] [Google Scholar]
- Poutanen, J., Ibragimov, A., & Annala, M. 2009, ApJ, 706, L129 [NASA ADS] [CrossRef] [Google Scholar]
- Psaltis, D., & Chakrabarty, D. 1999, ApJ, 521, 332 [Google Scholar]
- Ravi, V. 2017, ApJ, 851, 114 [NASA ADS] [CrossRef] [Google Scholar]
- Riggio, A., Di Salvo, T., Burderi, L., et al. 2008, ApJ, 678, 1273 [NASA ADS] [CrossRef] [Google Scholar]
- Riggio, A., Burderi, L., di Salvo, T., et al. 2011, A&A, 531, A140 [NASA ADS] [CrossRef] [EDP Sciences] [Google Scholar]
- Ross, R. R., & Fabian, A. C. 2005, MNRAS, 358, 211 [CrossRef] [Google Scholar]
- Russell, D. M., Fender, R. P., Hynes, R. I., et al. 2006, MNRAS, 371, 1334 [NASA ADS] [CrossRef] [Google Scholar]
- Russell, D. M., Fender, R. P., & Jonker, P. G. 2007, MNRAS, 379, 1108 [NASA ADS] [CrossRef] [Google Scholar]
- Russell, D. M., Bramich, D. M., Lewis, F., et al. 2019, Astr. Nac., 340, 278 [Google Scholar]
- Saikia, P., Russell, D. M., Bramich, D. M., et al. 2019, ApJ, 887, 21 [NASA ADS] [CrossRef] [Google Scholar]
- Sanna, A., Burderi, L., Riggio, A., et al. 2016, MNRAS, 459, 1340 [Google Scholar]
- Sanna, A., Bahramian, A., Bozzo, E., et al. 2018, A&A, 610, L2 [NASA ADS] [CrossRef] [EDP Sciences] [Google Scholar]
- Sanna, A., Burderi, L., Gendreau, K. C., et al. 2020, MNRAS, 495, 1641 [Google Scholar]
- Sanna, A., Bult, P., Ng, M., et al. 2022a, MNRAS, 516, L76 [NASA ADS] [CrossRef] [Google Scholar]
- Sanna, A., Burderi, L., Di Salvo, T., et al. 2022b, MNRAS, 514, 4385 [Google Scholar]
- Sanna, A., Jaisawal, G. K., Strohmayer, T. E., et al. 2025, A&A, 703, A171 [NASA ADS] [CrossRef] [EDP Sciences] [Google Scholar]
- Shahbaz, T., Paice, J. A., Rajwade, K. M., et al. 2023, MNRAS, 520, 542 [Google Scholar]
- Shakura, N. I., & Sunyaev, R. A. 1973, A&A, 24, 337 [NASA ADS] [Google Scholar]
- Spitkovsky, A. 2006, ApJ, 648, L51 [Google Scholar]
- Stetson, P. B. 1990, PASP, 102, 932 [Google Scholar]
- Sun, H., Zhang, M. H., Cheng, H. Q., et al. 2025, GRB Coordinates Network, 40375, 1 [Google Scholar]
- Williams, M. A., Kennea, J. A., Page, K. L., Evans, P. A., & Swift-XRT Team 2025, ATel, 17172, 1 [Google Scholar]
- Tonry, J. L., Denneau, L., Flewelling, H., et al. 2018, ApJ, 867, 105 [NASA ADS] [CrossRef] [Google Scholar]
- Valencic, L. A., Snowden, S. L., & Pence, W. D. 2016, AAS, 227, 348.17 [Google Scholar]
- van den Eijnden, J., Fender, R., Woudt, P., Miller-Jones, J., & Motta, S. 2022, ATel, 15462, 1 [Google Scholar]
- van Paradijs, J., & McClintock, J. E. 1994, A&A, 290, 133 [NASA ADS] [Google Scholar]
- Verner, D. A., Ferland, G. J., Korista, K. T., & Yakovlev, D. G. 1996, ApJ, 465, 487 [Google Scholar]
- Viironen, K., & Poutanen, J. 2004, A&A, 426, 985 [NASA ADS] [CrossRef] [EDP Sciences] [Google Scholar]
- Wang, Z., Chakrabarty, D., Roche, P., et al. 2001, ApJ, 563, L61 [NASA ADS] [CrossRef] [Google Scholar]
- Wang, Y., Bellm, E. C., & Jaodand, A. 2022, ATel, 15455, 1 [Google Scholar]
- Wijnands, R., & van der Klis, M. 1998, Nature, 394, 344 [CrossRef] [Google Scholar]
- Wijnands, R., Degenaar, N., Armas Padilla, M., et al. 2015, MNRAS, 454, 1371 [Google Scholar]
- Wilms, J., Allen, A., & McCray, R. 2000, ApJ, 542, 914 [Google Scholar]
- Zdziarski, A. A., Szanecki, M., Poutanen, J., Gierliński, M., & Biernacki, P. 2020, MNRAS, 492, 5234 [NASA ADS] [CrossRef] [Google Scholar]
Appendix A: Swift/XRT observations and spectral results
Swift/XRT observations of MAXI J1957+032.
Best-fitting model continuum for each Swift/XRT observation of MAXI J1957+032.
Appendix B: Optical photometry and calibration
During the 2025 outburst, MAXI J1957+032 was clearly detected in the g′, r′, and i′ bands between MJD 60803 and MJD 60806. Images obtained in the Y filter yielded only non-detections or upper limits. Photometry was extracted with the XB-NEWS pipeline (Russell et al. 2019; Goodwin et al. 2020), which performs MAP on SEXTRACTOR-detected sources (Bertin & Arnouts 1996) and calibrates instrumental magnitudes against the ATLAS-REFCAT2 catalogue (Tonry et al. 2018), supplemented with Pan-STARRS DR1 and APASS DR10 (Chambers et al. 2016; Henden et al. 2018). A spatially variable photometric model (Bramich & Freudling 2012) provided zero points and point spread function corrections through an iterative, outlier-weighted fit. Colour terms were neglected due to limited multi-band overlap, introducing systematics below 2%. Measurements with uncertainties > 0.25 mag were excluded. The final magnitudes, uncorrected for reddening, are listed in Table B.1.
Optical photometry of MAXI J1957+032 during the 2022 and 2025 outbursts.
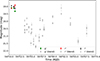 |
Fig. B.1. Optical light curves of MAXI J1957+032 obtained with LCO between June 20 (MJD 59750) and July 10, 2022 (MJD 59770), covering the entire outburst. Grey points mark measurements blended with the nearby star. The secondary maximum is clearly visible and fainter than the primary. |
All Tables
Best-fit spectral parameters from the model TBabs * (thComp*bbodyrad) for the XMM-Newton/PN spectrum.
Best-fitting model continuum for each Swift/XRT observation of MAXI J1957+032.
All Figures
|
Fig. 1. Multi-wavelength light curves of MAXI J1957+032 during the 2025 outburst. Top: 0.5–10 keV unabsorbed flux measured with Swift/XRT (blue points) and the XMM-Newton/PN observation (pink point). Bottom: Optical g′, r′, and i′ magnitudes from LCO (see Sect. 2.4). An additional observation performed on May 13, 2025 (MJD 60808), corresponding to the blend of MAXI J1957+032 with a g′∼20 nearby star, is shown for comparison. Error bars represent 1σ uncertainties. |
| In the text | |
|
Fig. 2. Summary of the timing analysis for MAXI J1957+032 from the XMM-Newton/PN observation. Top: 0.5–10.0 keV background-subtracted count rate versus time for each time interval adopted to estimate a significant pulse profile. Middle: Fractional amplitude of the fundamental harmonic in each H-test-selected segment. 1σ errors are from the photon bootstrap. Bottom: Pulse-phase residuals relative to the best-fitting coherent timing model (Table 1). The dashed grey line marks zero residual. Time is measured from T0 = 60805.40289977 MJD (TDB), and the horizontal axis along the top shows the corresponding orbital phase over the observation. |
| In the text | |
|
Fig. 3. Pulse profile of MAXI J1957+032 in the 0.50–6.5 keV band. Points (with 1σ errors) show the mean-normalised, 64-bin profile plotted over two cycles. The solid line is the weighted least-squares fit at the H-test-selected order (mopt = 5); dotted curves display the individually significant harmonic components (H1, H2, and H5). |
| In the text | |
|
Fig. 4. Energy dependence of the pulsations in MAXI J1957+032. The XMM-Newton/PN dataset is split into 16 significance-optimised bands spanning 0.5–10.0 keV. In each band, the signal is modelled with a pure sinusoidal function (fundamental harmonic) at the NS spin period. Panel (a): Relative phase of the fundamental as a function of energy. Panel (b): Fractional amplitude of the fundamental as a function of energy. |
| In the text | |
|
Fig. 5. Top: Unfolded average spectrum of the persistent emission from MAXI J1957+032. The blue curves represent Swift/XRT spectra, from the earliest observation (darkest blue) to the latest (lightest blue), fitted with the TBabs*powerlaw model (see Sect. 3.2.2). In the legend, Swift/XRT observations are labelled ‘SW’ followed by their Obs. ID (see Table A.1). The red curve shows the XMM-Newton/PN spectrum, fitted with TBabs*(thComp*bbodyrad) (see Sect. 3.2.1). Bottom: Residuals with respect to the adopted models. |
| In the text | |
|
Fig. 6. Temporal evolution of the main spectral parameters describing the continuum emission of MAXI J1957+032 observed with Swift/XRT (blue points) and XMM-Newton/PN (pink points). Top: Hardness ratio HR = F2 − 10/F0.5 − 2. Middle: NH. Bottom: Photon index (Γ). All values are listed in Tables A.2 and 2. Error bars represent 1σ uncertainties. |
| In the text | |
|
Fig. 7. SEDs of MAXI J1957+032 obtained from LCO observations between May 8 (MJD 60803) and May 11, 2025 (MJD 60806). Different colours and symbols correspond to the observation dates (MJDs 60803.1, 60803.3, 60805.0, and 60806.0), and the error bars indicate the propagated uncertainties, including both photometric and reddening contributions. |
| In the text | |
|
Fig. 8. Optical luminosity (de-reddened νLν in g′) versus X-ray luminosity (0.5–10 keV) for MAXI J1957+032. Black points and red diamonds show black-hole X-ray binaries in the hard and soft state, respectively; open circles represent NS systems (Russell et al. 2006, 2007). |
| In the text | |
|
Fig. B.1. Optical light curves of MAXI J1957+032 obtained with LCO between June 20 (MJD 59750) and July 10, 2022 (MJD 59770), covering the entire outburst. Grey points mark measurements blended with the nearby star. The secondary maximum is clearly visible and fainter than the primary. |
| In the text | |
Current usage metrics show cumulative count of Article Views (full-text article views including HTML views, PDF and ePub downloads, according to the available data) and Abstracts Views on Vision4Press platform.
Data correspond to usage on the plateform after 2015. The current usage metrics is available 48-96 hours after online publication and is updated daily on week days.
Initial download of the metrics may take a while.